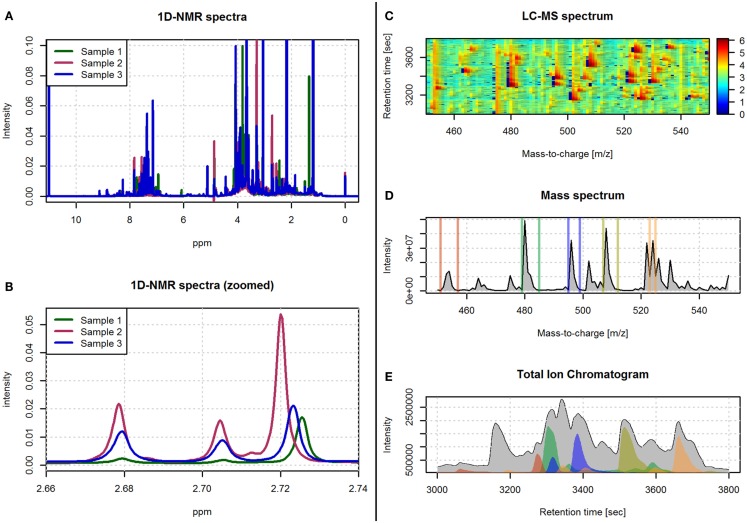
Figure 1.
Examples of spectra obtained with 1H-NMR and LC-MS technologies. (A) An example of three spectra obtained with 1D 1H-NMR. (B) A zoomed view of the spectra in (A) in the 2.66–2.74 ppm range. (C) An example of a LC-MS spectrum with color-coded intensity and referred by the m/z and retention time axes. (D) The sum of the LC-MS spectrum across the m/z axis. (E) The total ion chromatogram (i.e., sum of the LC-MS spectrum across the retention time axis). The colored regions in (E) correspond to the sum of the LC-MS spectrum limited to the m/z ranges depicted with the same color in (D).

