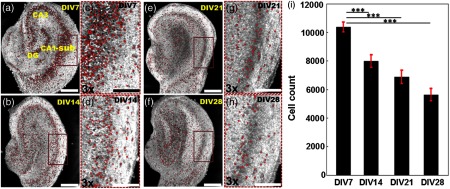
Fig. 5.

Representative OCM images obtained from different cultures on (a) DIV 7, (b) 14, (e) 21, and (f) 28, respectively. The representative OCM images were obtained from a depth of from the slice surface. (c), (d), (g), and (h) are the magnified images of the brown rectangular regions in (a), (b), (e), and (f), respectively. Viable neurons are marked as red dots. (i) Total viable neuron counts from the first of the organotypic hippocampal cultures from different DIVs. ***. Scale bars: in (a), (b), (e), and (f), in (c), (d), (g), and (h).
