
Figure 2.
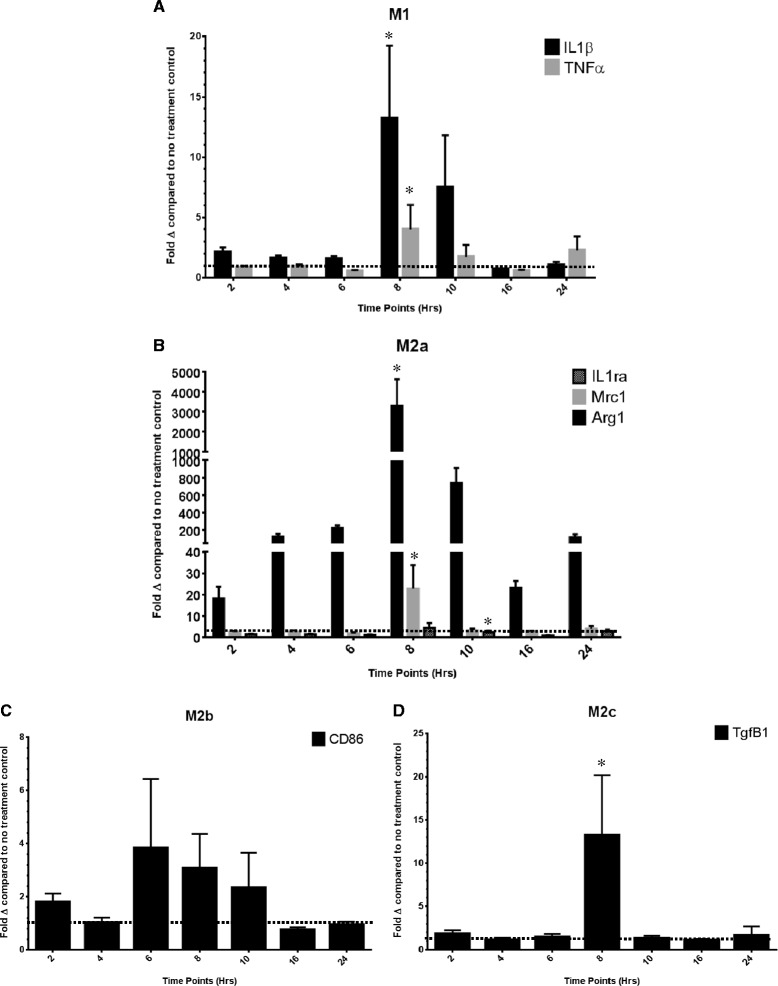
The relative gene expression for genes representative of the (A) M1, (B) M2a, (C) M2b and (D) M2c phenotypes of the IL-4-treated cell culture. Data are shown as the average fold change (± SEM) relative to the no treatment control at the 2-, 4-, 6-, 8-, 10-, 16- and 24-h time points. *The peak time point of gene expression determined by a repeated measures ANOVA of the fold changes in logarithmic form.