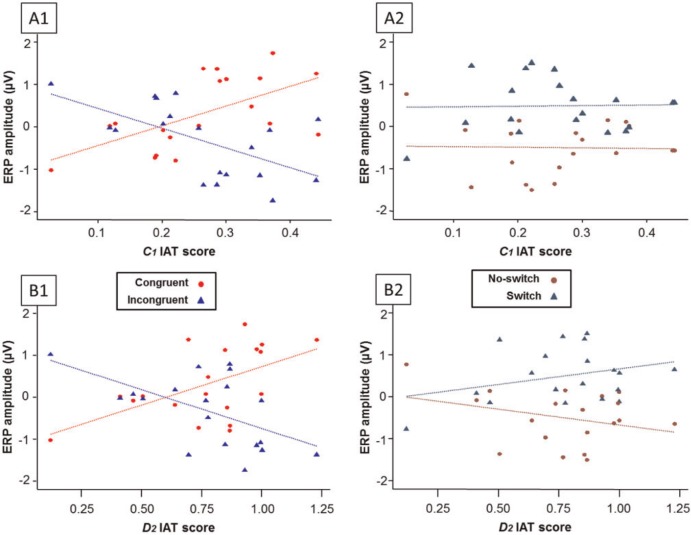
Fig. 2.
Scatterplots (with regression lines) depicting associations between ERP amplitudes and IAT scores as a function of congruency and switching factors. Panels A1 and A2 depict associations with C1 IAT scores; panels B1 and B2 depict associations with D2 IAT scores. ERP amplitudes depicted here are residual values after regressing out variance owing to subject and electrodes within subjects. Moving left-to-right on the graph, IAT score increases, as do the differences between switch and no-switch trials and congruent and incongruent trials.

