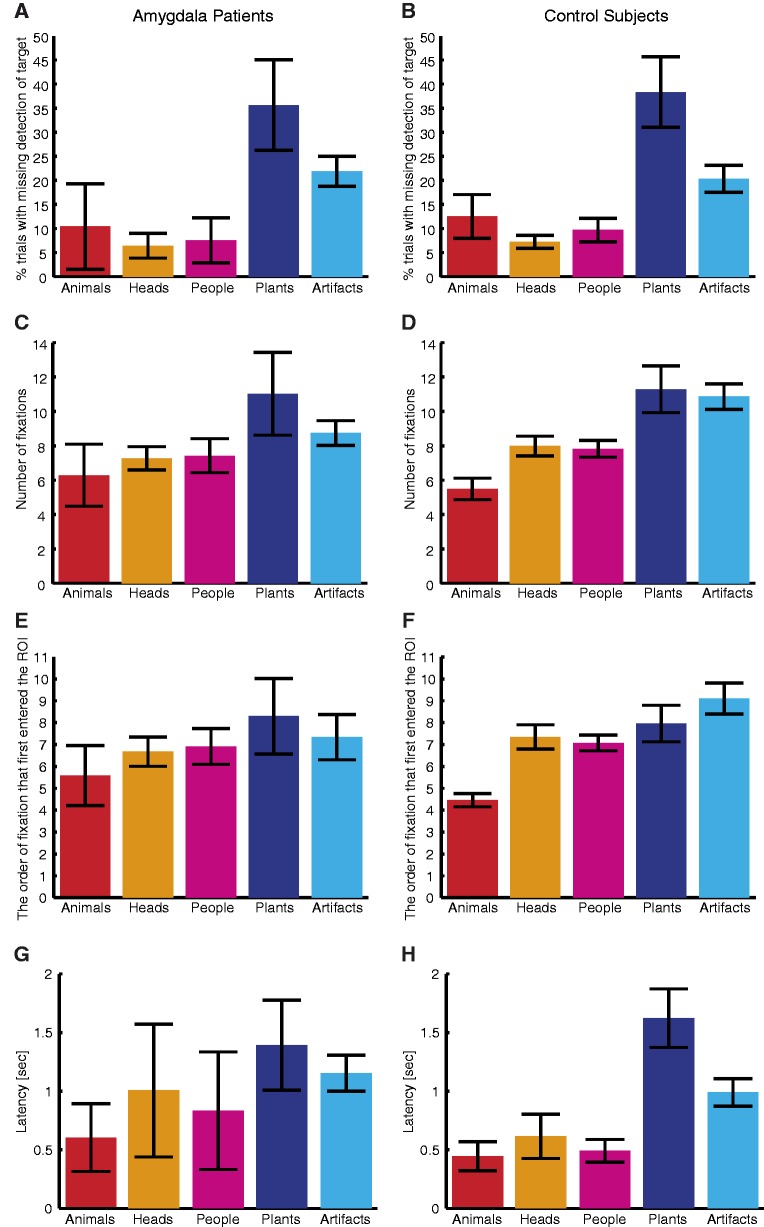
Fig. 3.
Quantification of fixation properties. (A and B) Percentage of trials with change blindness despite direct fixation on the change target. (C and D) Number of fixations before detecting changes. (E and F) The serial order of fixation that first entered the target ROI. (G and H) Latency from first fixation onto target to detection of target. (A, C, E and G) Amygdala lesion patients (N = 3). (B, D, F and H) Control subjects (N = 8). Error bars denote one s.e.m. across subjects.

