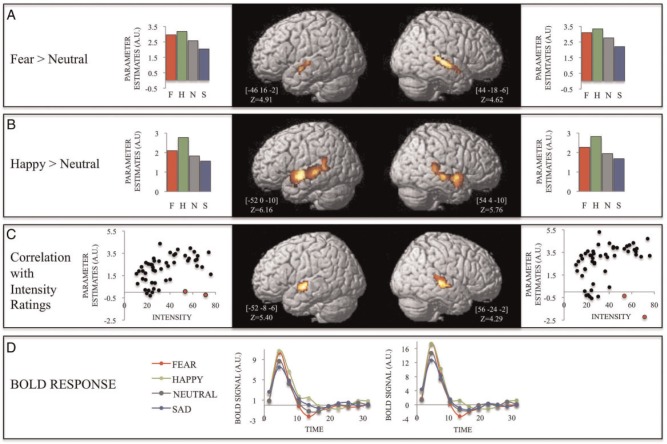
Fig. 4.
Significant clusters in the temporal lobe for the contrasts (A) Fear minus neutral and (B) Happy minus neutral for musical expressions, and the corresponding cluster-averaged parameter estimates. (C) Significant clusters associated with the correlation between BOLD signal and intensity ratings, and the corresponding cluster-averaged scatter plots. The two points in red in each graph represents measures with high Cook’s Distance scores (Left: 0.37 and 0.11; Right: 0.93 and 0.1). Removing these outliers increased the correlation values of the clusters in the left and right hemispheres to 0.52 and 0.48 (P < 0.0001), respectively. (D) Cluster-averaged evoked BOLD responses for fearful and neutral music for the clusters depicted in C.

