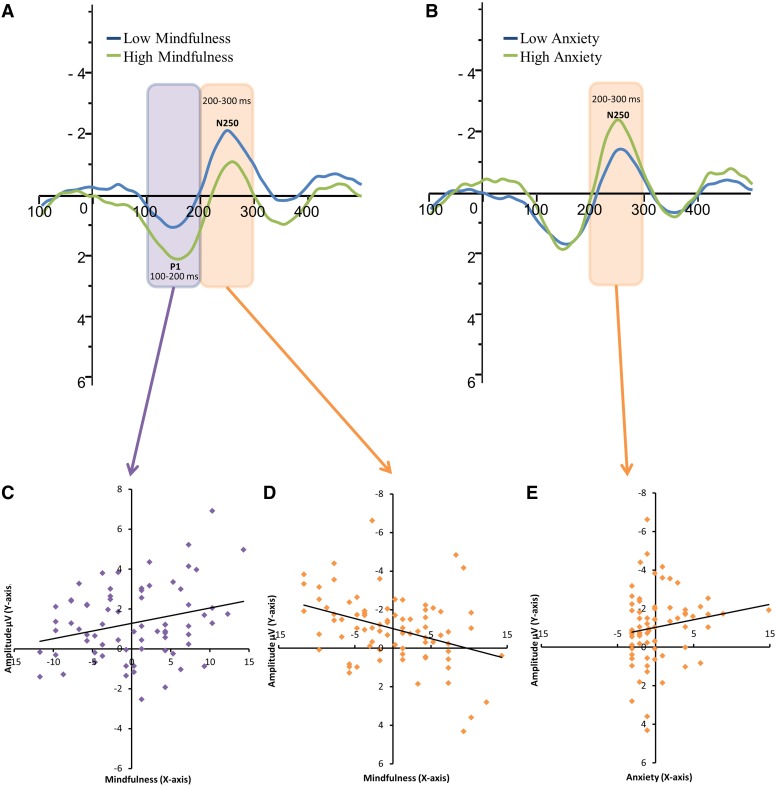
Fig. 3.
Group-average (N = 79) central (Cz) ERP response to the standard sound of infants of mothers with low (blue line) and high (green line) mindfulness (A) and anxiety (B). The scatterplots shows the correlation between maternal mindfulness and the amplitude of (C) the first positive-going wave ‘P150’ (measured from the 100–200 ms post-stimulus interval) and (D) the first negative-going wave ‘N250’ (200–320 ms). Panel (E) shows the scatterplot for the correlation between maternal anxiety and the amplitude of the ‘N250’ component. Notes: The statistical analyses were performed with mindfulness and anxiety as continuous predictors (C, D and E). Panels A and B are for illustration purposes only.

