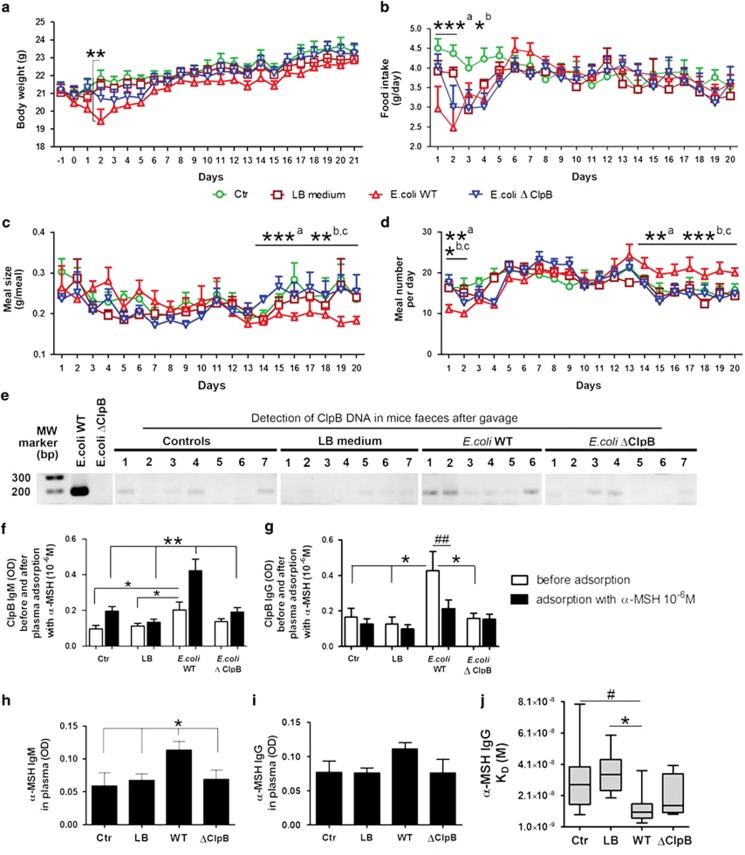
Figure 3.
E. coli supplementation in mice. Effects of intragastric daily gavage (days 1–21) in mice with either E. coli K12 wild-type (WT), ClpB-deficient (ΔClpB) E. coli K12 or LB medium on body weight (a), food intake (b), meal size (c) and meal number (d). (e) PCR detection of a 180-base pair fragment of the bacterial ClpB DNA, first lane, molecular weight marker, second lane DNA from in vitro cultures of E. coli K12 WT, third lane DNA from in vitro cultures of E. coli K12 ΔClpB, and the remaining lanes DNA from mice feces collected at day 21. Plasma levels in optical density in enzyme-linked immunosorbent assay of anti-ClpB IgM (f) and IgG (g) before and after adsorption with 10−6 M α-MSH. Plasma levels of anti-α-MSH IgM (h) and IgG (i). (j) Affinity (equilibrium constant) of anti-α-MSH IgG. (a) Two-way repeated measurements analysis of variance (ANOVA), P=0.3, Bonferroni post test day 2, **P<0.01 control (Ctr) vs E. coli WT. (b) ANOVA days 1–2, P=0.0006, Tukey's post tests ***P<0.001, *P<0.05, E. coli WT vs aCtr and bLB. (c) Kruskal–Wallis (K–W) test third week P=0.0001, Dunn's post tests, ***P<0.001, **P<0.01, E. coli WT vs aCtr, bLB and CΔClpB. (d) ANOVA days 1–2, P=0.006, Tukey's post tests **P<0.01, *P<0.05, K–W test third week P<0.0001, Dunn's post tests, ***P<0.001, **P<0.01, E. coli WT vs aCtr, bLB and CΔClpB. (f) K–W test, before adsorption P=0.02, Dunn's post tests *P<0.05, ANOVA after adsorption, P<0.0001, Tukey's post tests **P<0.01, E. coli WT vs other groups. (g) ANOVA before adsorption, P=0.01, Tukey's post tests *P<0.05, E. coli WT vs other groups, paired t-test ##P<0.01. (h) Student's t-test, E. coli WT vs other groups *P<0.05. (j) K–W test P=0.02, Dunn's post test *P<0.05, Mann–Whitney test, #P<0.05. (mean±s.e.m., n=8).

