
Figure 5.
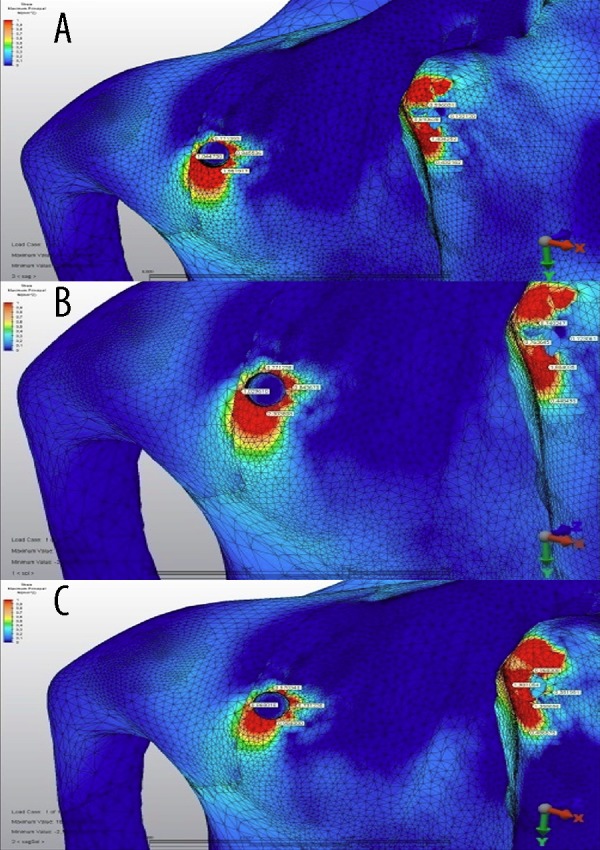
The maximum principle stress distributions in the maxilary bone around implants under (A) first loading, (B) second loading, and (C) third loading conditions for model 1 (unit: MPa). Colors show level of stress from dark blue (lowest) to red (highest).