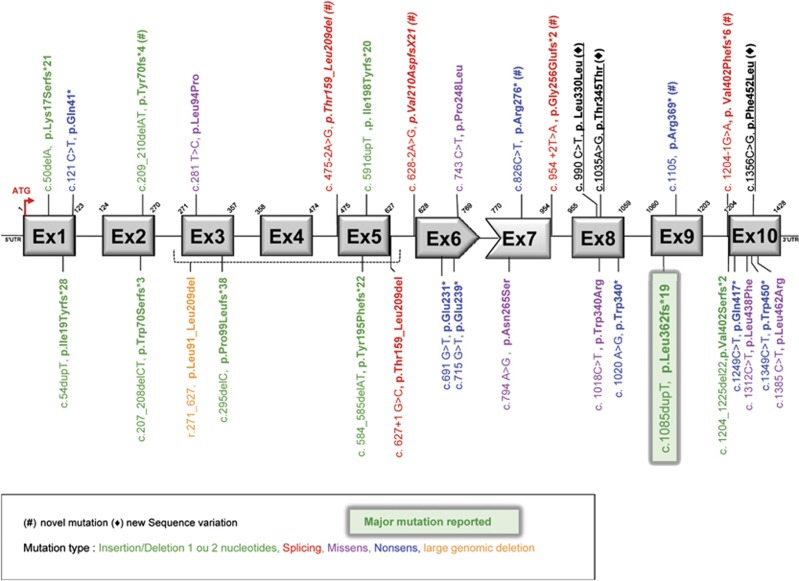
Figure 4.
Distribution of pathogenic mutations and sequence variations in ZMPSTE24. Exons are shown as gray rectangles. A red arrow indicates the ATG start and adenine is numbered as nucleotide 1. Frame-shift mutations are shown in green, missense mutations leading to amino-acid changes in purple and nonsense mutation in blue. One large genomic deletion is shown in orange and mutations affecting consensus splice sites are shown in red. Novel mutations are indicated by (#); (♦) indicates new sequence variations identified during our screening.

