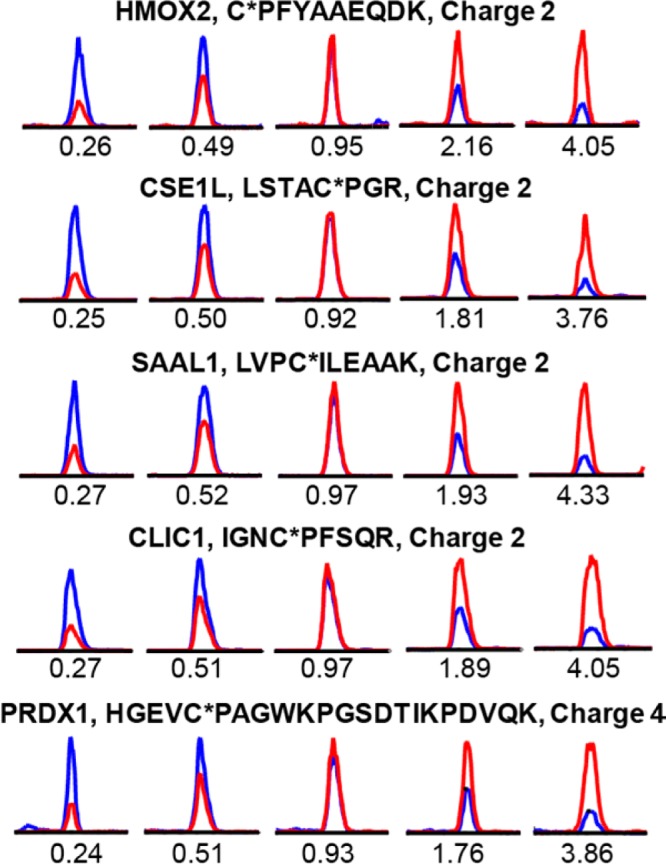
Figure 3.

Representative extracted ion chromatograms (XIC) for the IPM-labeled peptides from five proteins at predefined ratios (L/H = 1:4, 1:2 1:1, 2:1, 4:1, from left to right). The profiles for light- and heavy-labeled peptides are shown in red and blue, respectively. The peptide sequence, modified sites (with asterisk), and charge status are shown above the individual chromatograms. The measured light/heavy ratios (RL/H) are displayed below each individual chromatogram.
