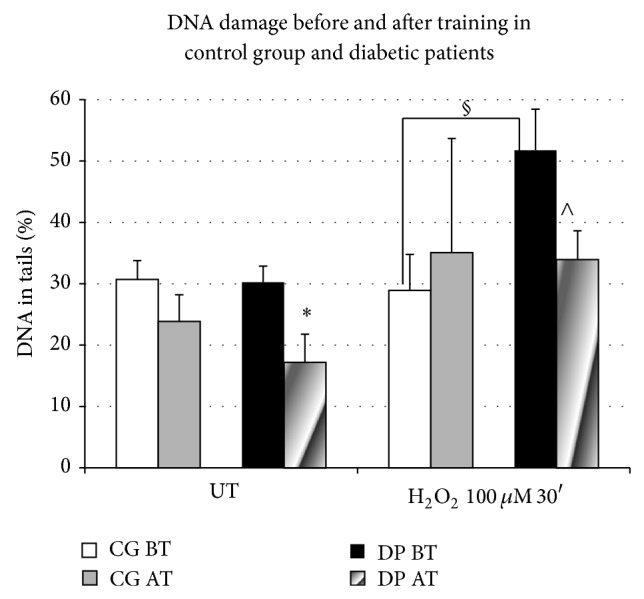
Figure 5.

% of DNA in tails in untreated and H2O2-treated PBLs before training (BT) and after training (AT) in control group (CG) and diabetic patients (DP). DP showed a significant diminution in % DNA in tails in untreated samples (UT) (* P = 0.02). In the H2O2 treated samples (H2O2, 100 uM × 30′), the percentages of DNA in tails were different between DP and CG before training (§ P = 0.049), and a significant diminution after training in the DP nuclei (∧ P = 0.04) was observed.
