
Fig. 1.
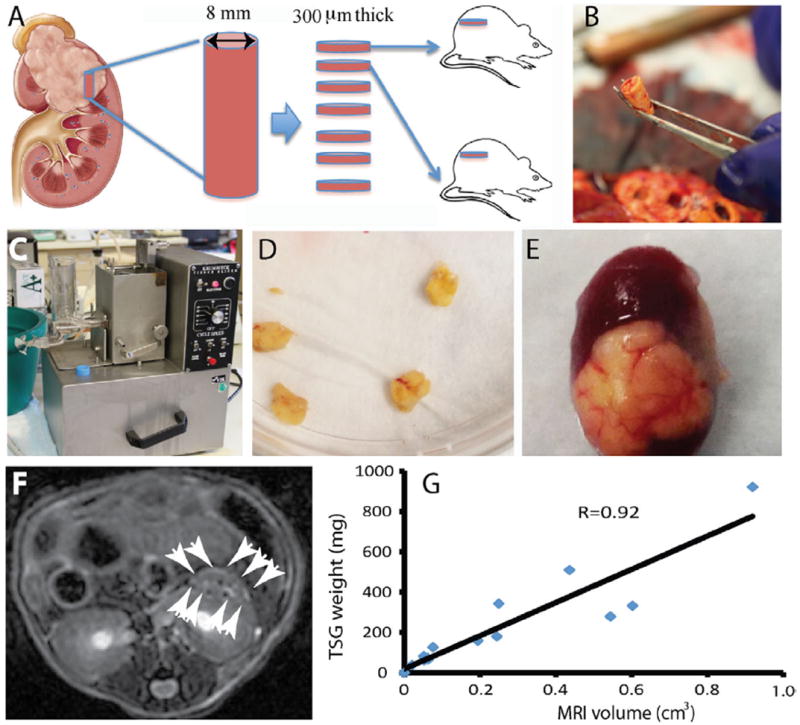
Generation and imaging of TSGs. (A) diagram of TSG generation. (B) a tissue core taken from cancer area of a fresh nephrectomy specimen. (C) Krumdieck tissue slicer. (D) tissue slices precision-cut to 8 mm in diameter and 300 μm in thickness. (E) a representative TSG with good vascularization. (F) a representative MRI image of TSG with white arrows marking the boundary. (G) correlation of tumor volume determined by MRI and graft weight for TSGs derived from case 2. (Color version of the figure is available online.)