
Fig. 4.
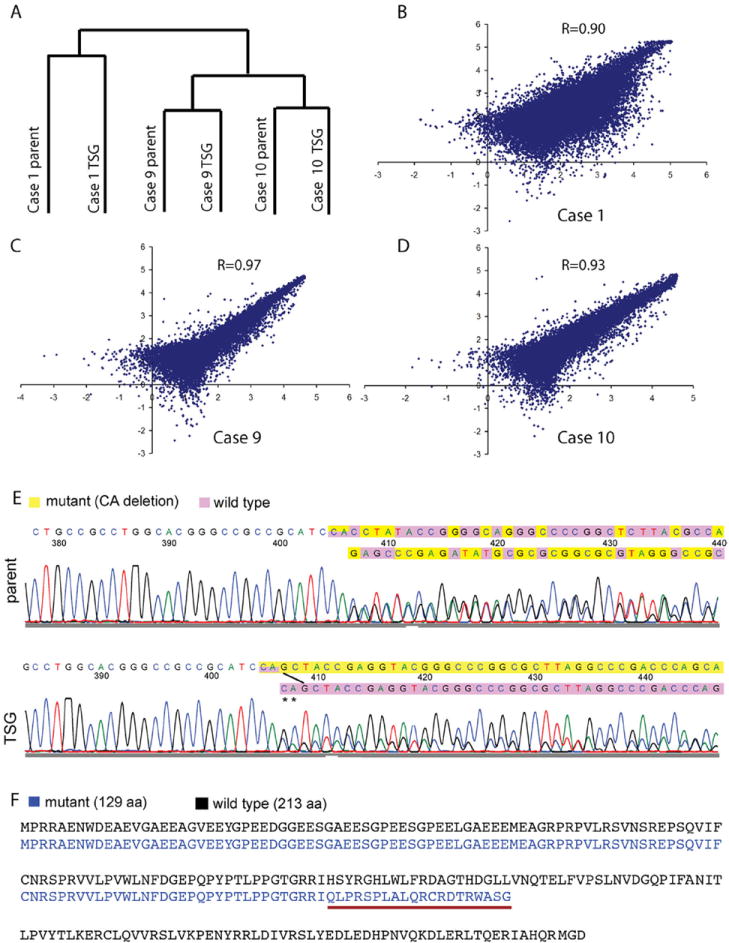
TSGs maintained similar global gene expression and identical genetic mutation of VHL to the parental tumors. (A) dendrogram of average linkage clustering of 3 pairs of TSGs and their corresponding parental tumors. (B–D) scatter plots of gene expression in TSGs and corresponding parental tumors with correlation coefficients. (E) a “CA” deletion in exon 1 was identified in the parental tumor and TSG from case 9. The mutant VHL sequence was shown in yellow and the wild type in purple. The ratio of mutant to wild-type VHL nucleotide signal was increased in the chromatogram from TSG. (F) wild-type VHL protein sequence is in black. Mutant VHL protein sequence in case 9 is in blue. Mutant protein sequence underlined in red after the mutation is different from wild type due to a frameshift. The mutation also caused an early stop resulting in a truncated protein of 129 amino acids compared with the wild-type protein of 213 amino acids. (Color version of the figure is available online.)