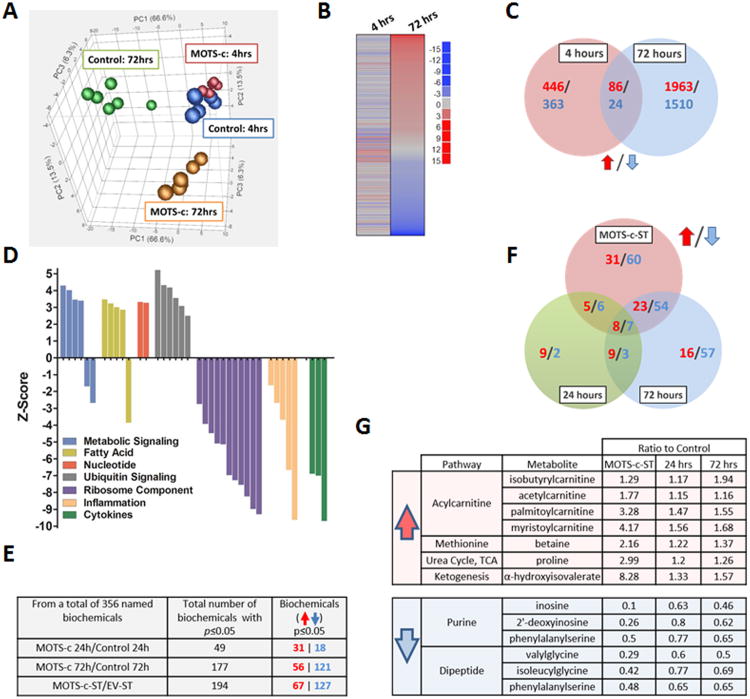
Figure 2. MOTS-c is a bioactive peptide that regulates gene expression and cellular metabolism.
(A to D) Microarray analyses on HEK293 cells treated with MOTS-c (10 μM) for 4- and 72-hours (N=6). (A) Principal component analysis (PCA), (B) Parametric analysis of gene set enrichment (PAGE) relative to control cells at the same time point, (C) Venn diagram depicting upregulated (Red) and downregulated (Blue) genes per time point. (D) Gene ontology analysis on HEK293 cells treated with MOTS-c for 72-hours. (E-G) Global unbiased metabolomics on HEK293 cells treated with MOTS-c (10 μM) for 24-and 72-hours or stably transfected with MOTS-c (MOTS-c-ST) or empty vector (EV-ST) (N=5). Welch's two sample t-test. (E) Total number of significantly or near-significantly changed metabolites. (F) Venn diagram depicting upregulated (Red) and downregulated (Blue) metabolites in MOTS-c-ST cells and HEK293 cells treated with MOTS-c for 24-and 72-hours compared to their controls. (G) List of metabolites that were consistently altered in all 3 groups. See also Table S2.

