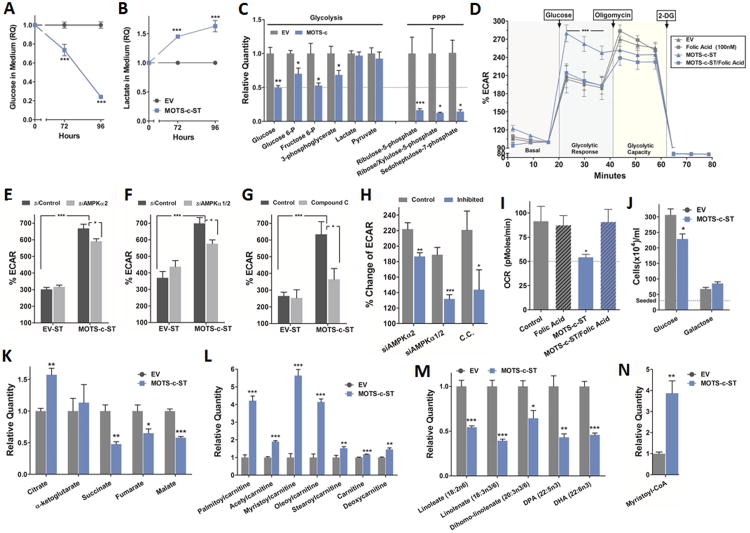
Figure 4. MOTS-c coordinates cellular glucose, mitochondrial, and fatty acid metabolism.
Extracellular (A) glucose and (B) lactate in the culture medium of MOTS-c-ST cells (N=6). (C) Intracellular metabolites of glycolysis and the pentose phosphate pathway (PPP) in MOTS-c-ST cells (N=5). Cells were seeded and allowed to acclimate for 72 hours prior to collection, at which time they were 90-95% confluent. (D) Real-time glycolytic flux determined by extracellular acidification rate (ECAR) in MOTS-c-ST cells treated with folic acid (100nM) for 72 hours (N=6). (E-H) Glucose-stimulated real-time glycolytic measurements in MOTS-c-ST cells treated with (E) siRNA against AMPKα2 (48-hours), or (F) siRNA against AMPKα1/2 (48-hours), or (G) compound C (10μM) (24-hours) and (H) the relative percent changes of ECAR of each treated groups to their corresponding controls in (E-G). (I) Real-time oxygen consumption rate (OCR) in MOTS-c-ST cells treated with folic acid (100nM) for 72 hours (N=6). All values normalized against DNA content. (J) MOTS-c-ST cell proliferation after 72 hours under equimolar (25mM) glucose or galactose medium (N=6). (K) Tricarboxylic acid (TCA) cycle intermediates in MOTS-c-ST cells (N=5). (L) Acyl-carnitine shuttle levels, (M) essential fatty acid levels, and (N) the β-oxidation intermediate myristoyl-CoA levels in MOTS-c-ST cells (N=5). Data shown as mean ± SEM. Student's t-test. *P<0.05, **P<0.01, ***P<0.001. See also Figures S3 and S4 for data on exogenous MOTS-c treatment, null MOTS-c mutants and non-specific scrambled MOTS-c peptide, and the role of SIRT1 in mediating the glycolytic effects of MOTS-c.

