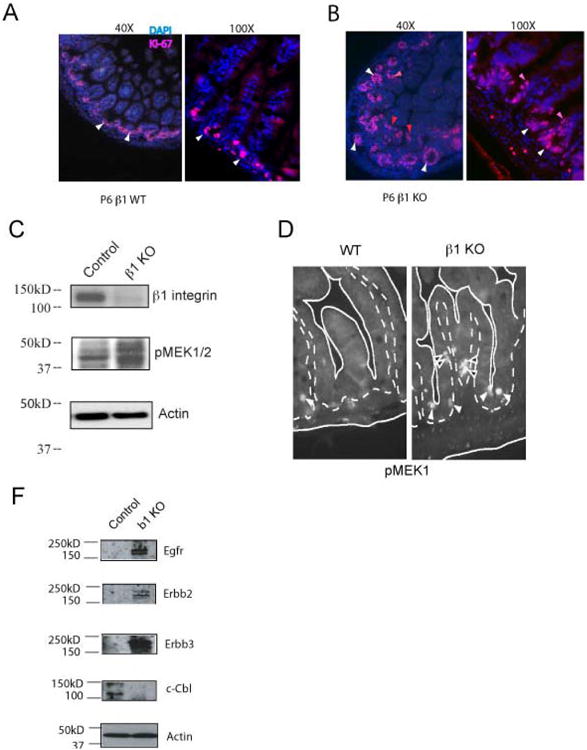
Figure 2. Evidence of increased proliferative signal transduction in intestinal epithelium from Itgb1Δ mice.

A-B, Ki-67 immunofluorescence micrographs of small intestinal sections of P6 WT (A) and P6 Itgb1Δ mice (B) The white and red arrows identify Ki-67-positive intestinal epithelial crypt and villous cells, respectively. *p < 0.05 compared with controls. C, Western blots showing expression of integrin β1 and levels of phospho-MEK-1/2 proteins in intestinal epithelial cells of P6 WT and Itgb1Δ mice. Actin loading controls are shown. The results shown are typical to two separate experiments. D, Immunofluorescence micrographs showing phospho-MEK1 in intestinal epithelial cells in the small intestinal crypts (white arrowheads) and villi (black arrowheads) of P6 WT and Itgb1Δ mice. Solid lines outline crypts and villi. Dotted lines outline the border of intestinal epithelial cells and stroma. E, Immunoblots showing EGFR, ErbB-2, ErbB-3, c-Cbl, and actin protein levels in small intestinal epithelial cell lysates obtained from WT and Itgb1Δ mice. The results shown are typical of two separate experiments.
