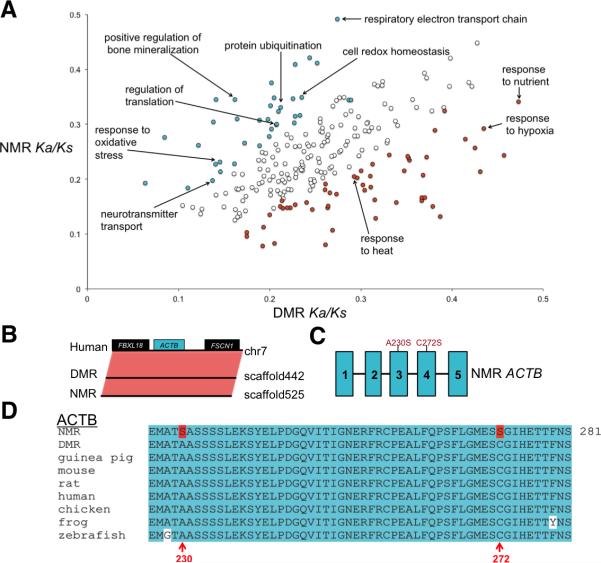
Figure 4. Adaptive evolution in the NMR and DMR genomes.
(A) Accelerated evolution of NMR and DMR genomes. GO categories with putatively accelerated (P ≤ 0.05, binomial test) non-synonymous divergence in the NMR lineage (turquoise) and in the DMR lineage (orange) are highlighted. (B) Conserved gene synteny of the β-actin gene (ACTB) region between human, DMR and NMR. Boxes represent genes. (C) Schematic of the intron and exon structure of the ACTB, along with the location of amino acid changes found in the NMR ACTB protein. Turquoise boxes represent exons. (D) NMR has unique amino acid changes (highlighted in red) in the highly conserved (turquoise) ACTB, including the redox-sensitive Cys272 residue. See also Figure S3.

