
Fig. 4. Soluble platelet-derived growth factor receptor β in the cerebrospinal fluid in humans and mice.
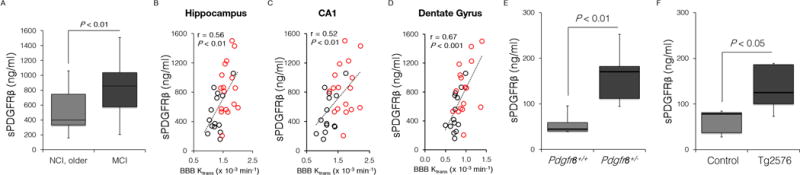
(A) Elevated sPDGFRβ levels in the CSF in individuals with mild cognitive impairment (MCI; n=17) compared to age-matched group with no cognitive impairment (NCI, older; n=14). (B–D) Single data points for sPDGFRβ CSF levels from 31 individuals with NCI (n=14, black) or MCI (n=17, red) plotted against the Ktrans constant in the hippocampus (B), its CA1 region (C), and dentate gyrus (D); r = Pearson’s coefficient; P, significance. (E–F) sPDGFRβ CSF levels in 16-month-old Pdgfrβ+/− mice and Pdgfrβ+/+ controls (C) and 16-month-old Tg2576 mice compared to age-matched littermate controls (D). In C and D, n=5 mice per group. P, significance by a Student’s t-test. See also Supplementary Figures S3 and S4.