
Fig. 2.
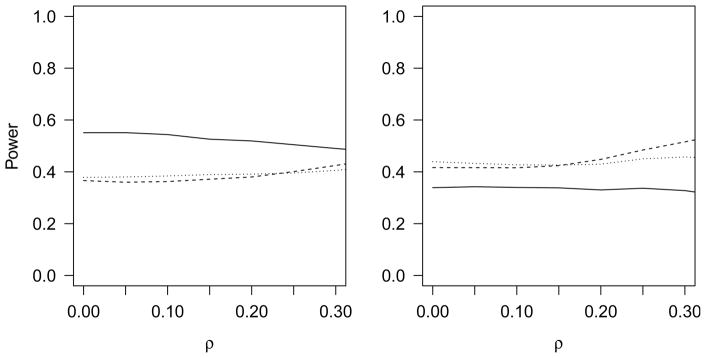
The power for various methods are compared. The higher criticism applied to the decorrelated test statistics is represented by the solid line. The likelihood ratio test is represented by the dotted line. The sequence kernel association test is represented by the dashed line. Power is simulated for each ρ that is a nonnegative multiple of 0·05 and the smoothed results are displayed. Signal sparsity is 5% with β = 0.11 in the left plot with signal sparsity 10% with β = 0.08 in the right plot.