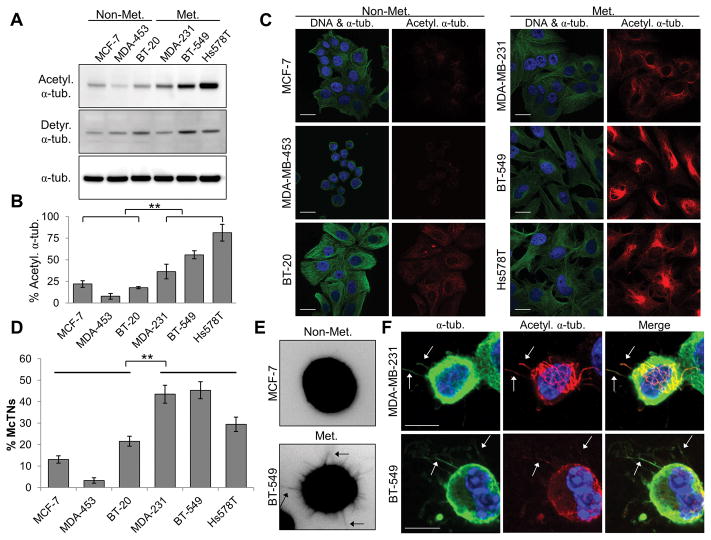
Figure 1. Metastatic breast tumor cell lines have high acetylation of α-tubulin that is enriched in more numerous McTNs.
(A) Lysates from non-metastatic (Non-Met.) and metastatic (Met.) breast cancer cell lines were subjected to immunoblot analysis for α-tubulin post-translational modifications. (B) Densitometric analysis of acetylated α-tubulin, as compared to total α-tubulin. Error bars indicate +/− standard deviation, n=3. Non-Met. vs. Met. breast tumor cells: **p<0.01 (C) Immunofluorescence for DNA (blue), α-tubulin (green), and acetylated α-tubulin (red). Scale bar=20 μm. (D) McTN counts, with data represented as the mean +/− standard deviation of n=3 experiments with at least 100 cells scored blindly in each independent experiment. **p<0.01 between Non-Met. and Met. McTN counts. (E) Representative suspended-cell images highlighting McTN protrusions (arrows). (F) Suspended cell immunofluorescence indicates acetylated α-tubulin (red) localizes along α-tubulin (green)-based protrusions in metastatic cells. DNA is stained in blue. Arrows indicate McTNs. Scale bar=10 μm.

