Figure 1.

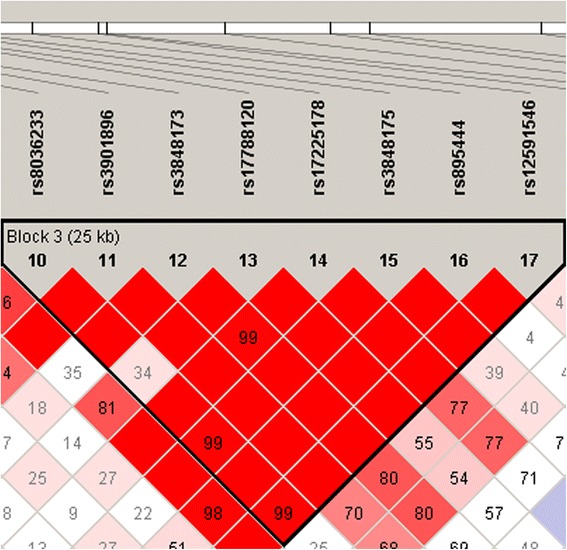
Linkage disequilibrium blocks in the ARNT2 gene calculated in our sample (detail). Block 3 is shown. It includes eight SNPs analysed in the current study. Numbers into the squares indicate D’ values.

Linkage disequilibrium blocks in the ARNT2 gene calculated in our sample (detail). Block 3 is shown. It includes eight SNPs analysed in the current study. Numbers into the squares indicate D’ values.