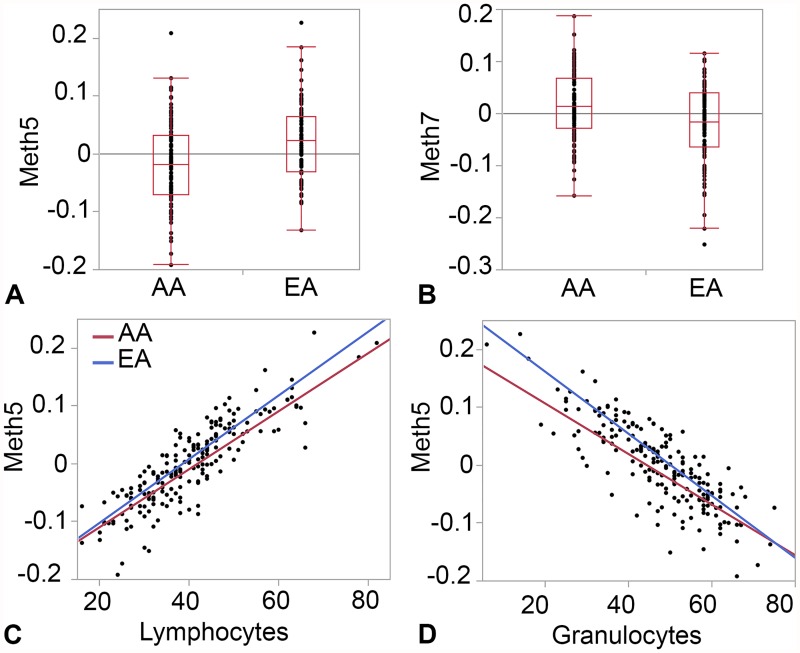
Fig 1. Ancestry-specific methylation modules in CANDLE.
Box plots show differences in module eigengenes between African Americans (AA) and European Americans (EA) for Meth5 (A) and Meth7 (B). Scatter plots show the correlation between the cell-type specific Meth5 module and estimated fractions of lymphocytes (C) and granulocytes (D).

