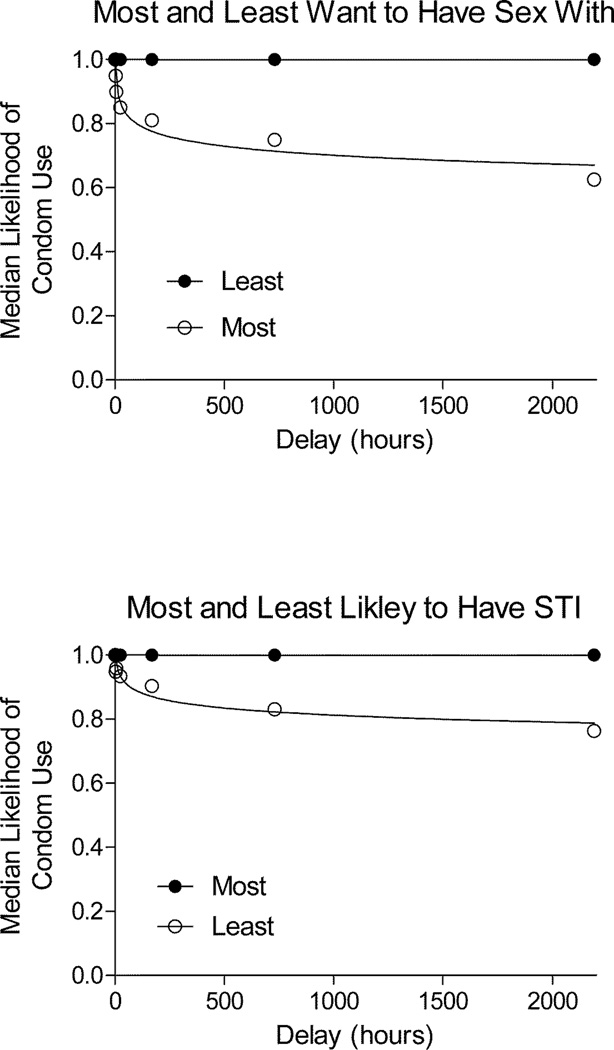
Figure 1.
Sexual discounting group median data with fest-fit hyperbolic curves. Median values and curves are based upon data in which all individuals values have been standardized by (divided by) the individual’s value for condom use in the zero delay condition. The resulting values and curves represent the degree to which condom use likelihood decreases as a result of delay, controlling for differences in likelihood of condom use when no delay is involved. The top panel presents data from the ‘most’ and ‘least’ likely to have an STI conditions. The bottom panel presents data from the ‘most’ and ‘least’ want to have sex with conditions.

