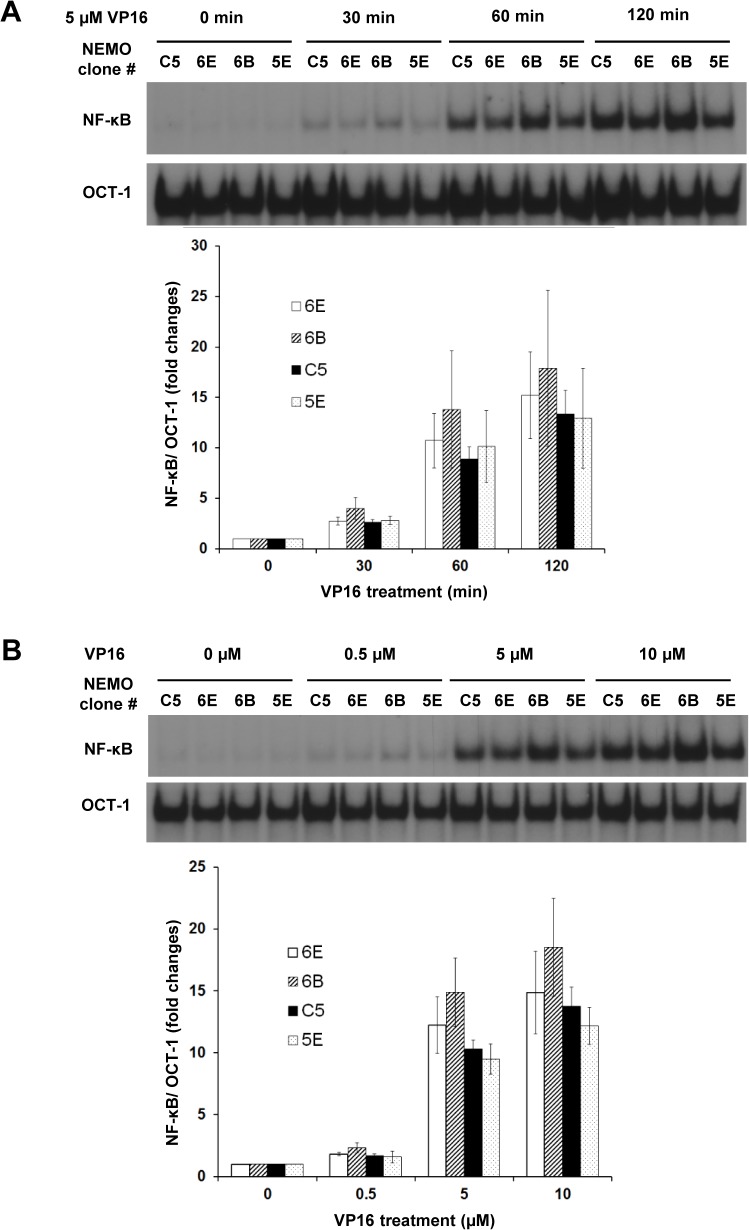
Fig 5. Effects of NEMO amount on NF-κB activation in response to etoposide.
(A) Time course analysis. The indicated 1.3E2 clones were left untreated or treated with 5 μM VP16 for indicated times and analyzed by EMSA. Three independent experiments were performed as above on different days. The NF-kB bands were quantified and fold inductions of NF-κB DNA binding activity were graphed below. Error bars represent S.E.M. (B) Dose response analysis. The indicated 1.3E2 clones were left untreated or treated with the indicated concentration of etoposide (VP16) for 1 hr. The quantification and graph were done as in A.

