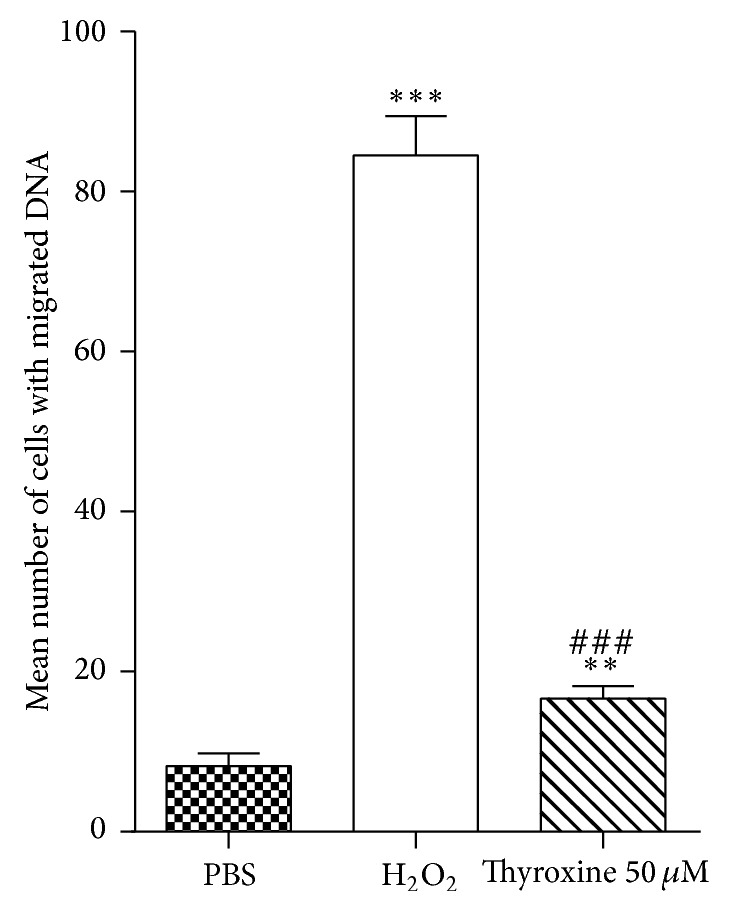
Figure 2.

Degree of DNA damage in human leukocytes exposed to thyroxine and H2O2 treated positive control separately, compared to negative control treated with PBS. ** P < 0.01, *** P < 0.001 thyroxine and H2O2 treatment versus PBS; ### P < 0.001 thyroxine versus H2O2 by Mann Whitney test. Data represent mean ± SEM from 6 subjects.
