Figure 2.

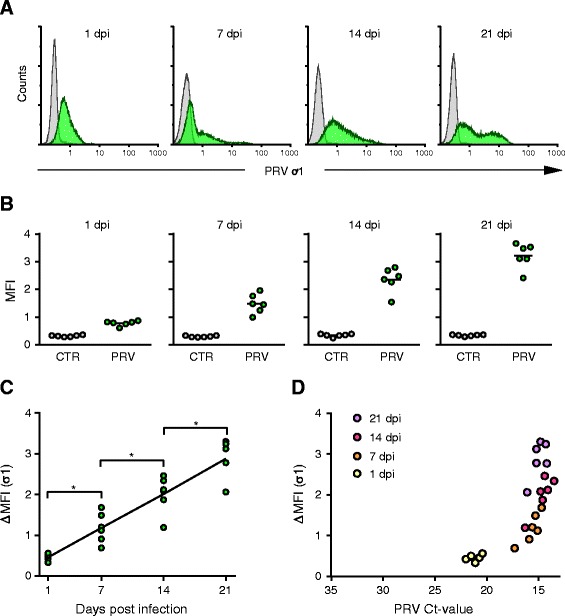
Detection of PRV ơ1 protein by flow cytometry in the 1 st passage. (A) Results from intracellular staining for PRV ơ1 protein from PRV infected culture (green) and control culture (grey) at 1, 7, 14 and 21 days post infection (dpi). The fluorescence intensity (PRV ơ1) is shown on the X-axis and cell count on the y-axis counting 30 000 cells per sample. The results of one individual are presented to illustrate the staining pattern. (B) Plot of the arithmetic mean fluorescence intensity (MFI) for all PRV infected (green) and control (grey) cultures (n = 6) at each time point. (C) The amount of PRV ơ1 protein detected presented by ΔMFI (MFI Infected – MFI Control) at 1, 7, 14 and 21 dpi. Data were analyzed using Wilcoxon matched pairs signed rank test. *p < 0.05. (D) The correlation between the amount of PRV nucleic acid and PRV ơ1 protein detected during the cultivation is illustrated by plotting PRV Ct-values (X-axis) against the ΔMFI for PRV ơ1 (Y-axis) color coding the different time points; 1 dpi (yellow), 7 dpi (orange), 14 dpi (red) and 21 dpi (purple).
