
Figure 4.
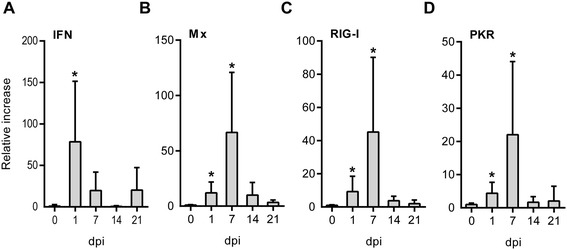
Erythrocytic antiviral responses to PRV infection. Expression of genes involved in antiviral responses was measured by RT-qPCR. The expression levels in infected RBC relative to the paired non-infected controls were calculated for each sample (n = 6) at 1, 7, 12 and 21 dpi. The relative increase (and SD) for IFNα (A), Mx (B), RIG-I (C) and PKR (D) is shown. Data were analyzed using Wilcoxon matched pairs signed rank test. *p < 0.05.