
Figure 5.
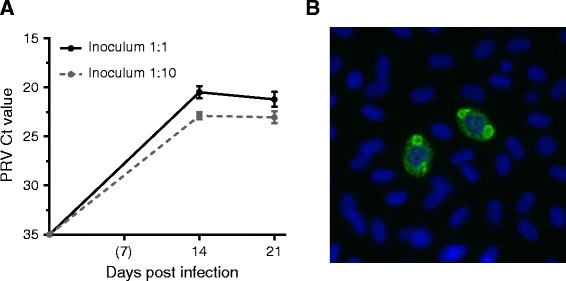
RT-qPCR and PRV ơ1 staining from the 2 nd passage. (A) Mean PRV Ct value (and SD) detected by RT-qPCR in red blood cells (RBC) at 14 and 21 dpi (n = 6) during the second passage. Results are shown for cultures infected with undiluted and diluted (1:10) inoculum from the 1st passage. (B) Immunofluorescence microscopy picture showing the PRV ơ1-protein (green) in cells at 14 dpi infected by undiluted inoculum. Cell nuclei stained with Hoechst (blue).