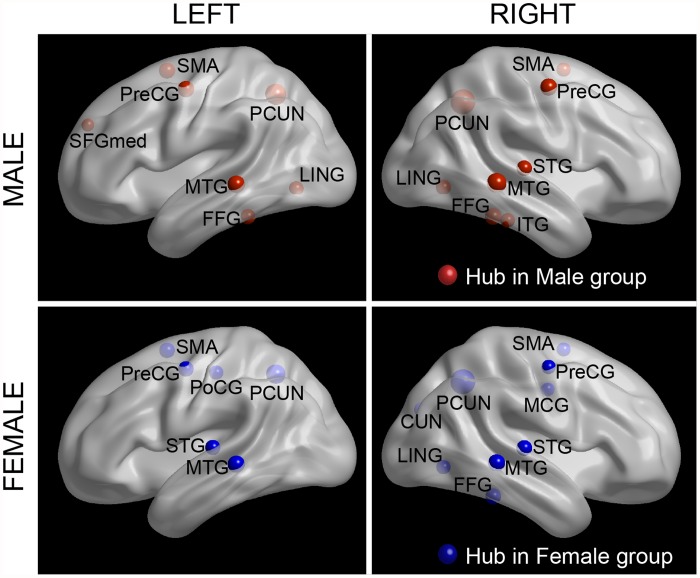
Fig 2. The global network hubs with high betweenness centrality in male subjects and female subjects.
Regions with betweenness centrality one S.D. greater than the average over the network were identified as hubs. The hub nodes are shown in red (male) and blue (female) with node size representing their normalized nodal betweenness centrality. The regions were overlaid on the brain surface at the Medium view. The nodal regions are located according to their centroid stereotaxic coordinates. The figures were visualized with BrainNet Viewer software (http://www.nitrc.org/projects/bnv/).

