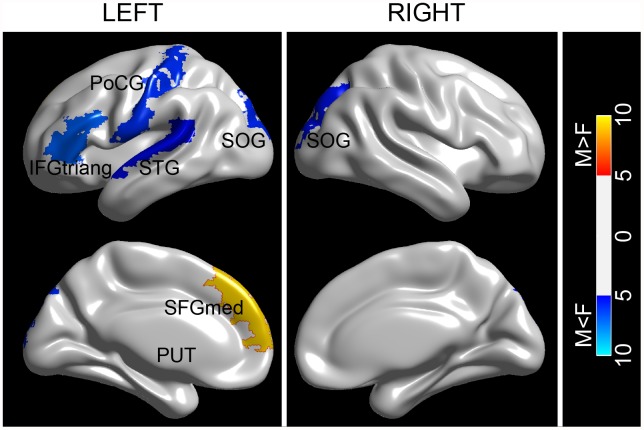
Fig 3. The spatial distribution of cortical regions showing significant gender effect.
The color bar represents F values of group comparison. L and R represent left and right hemisphere, respectively. For the abbreviations of the cortical regions, see Table 1. The figures were visualized with BrainNet Viewer software (http://www.nitrc.org/projects/bnv/).

