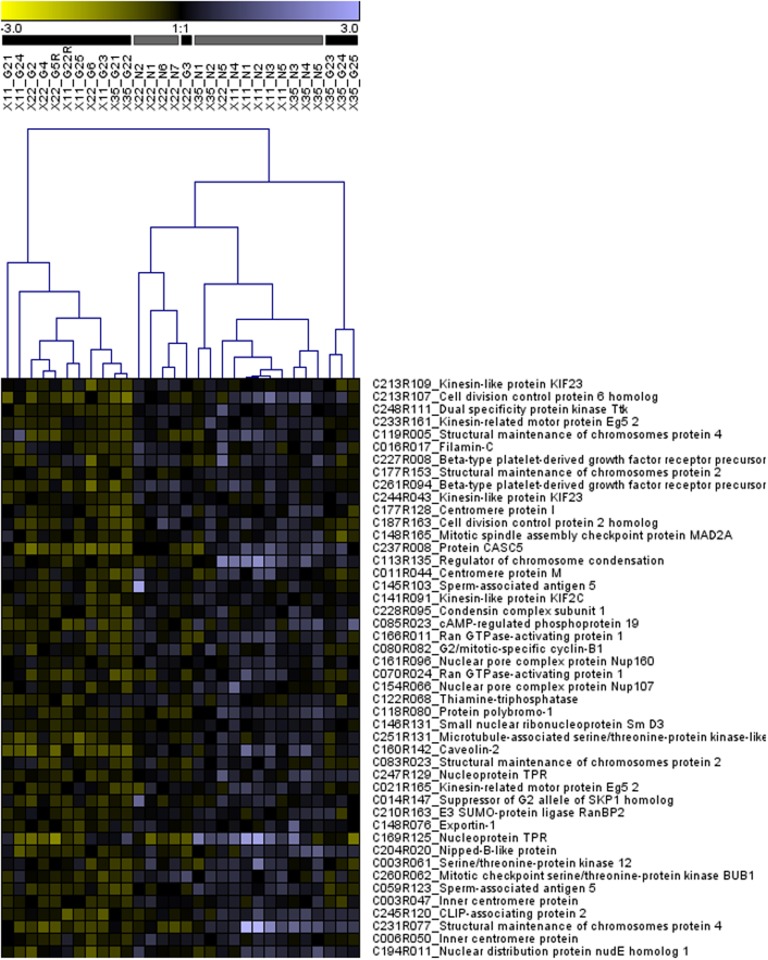
Fig 4. Hierarchical clustering of 46 genes associated with the GO term “mitosis” that were differentially transcribed by salmon juveniles reared in enriched and unenriched hatchery environments (also see Table C in S1 File).
Grey and black color bars located above the columns correspond to individuals reared in unenriched and enriched hatchery environments, respectively. Above these bars, each profile is labeled by family (X11, X22, X35), whether the individual was reared in the enriched “gravel” (G) or unenriched “no gravel” (N) treatment, and by individual identification number. For a given gene (i.e. row in heatmap) higher and lower gene transcript abundance, relative to the common reference sample, is indicated in purple and yellow, respectively.

