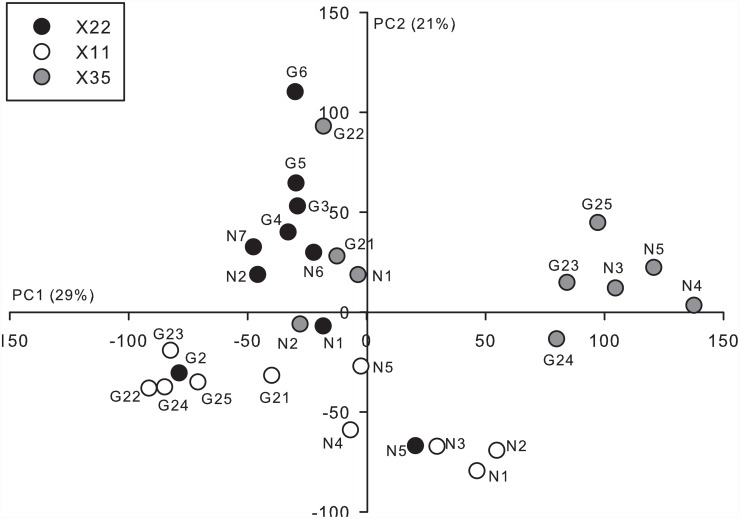
Fig 5. Principal components analysis of the head transcription profiles of Atlantic salmon juveniles exposed to either an unenriched or enriched hatchery rearing environment during early development.
Principal component (PC) scores for individuals from family X35, X11, and X22, are shown by the grey, open, and black circles, respectively. The points are also labeled by individual ID and whether they were reared in a hatchery environment with (G) or without (N) the addition of gravel substrate for environmental enrichment. PC axes 1 and 2 explained 29% and 21% of the respective variation in relative gene transcript abundance observed among the juveniles.

