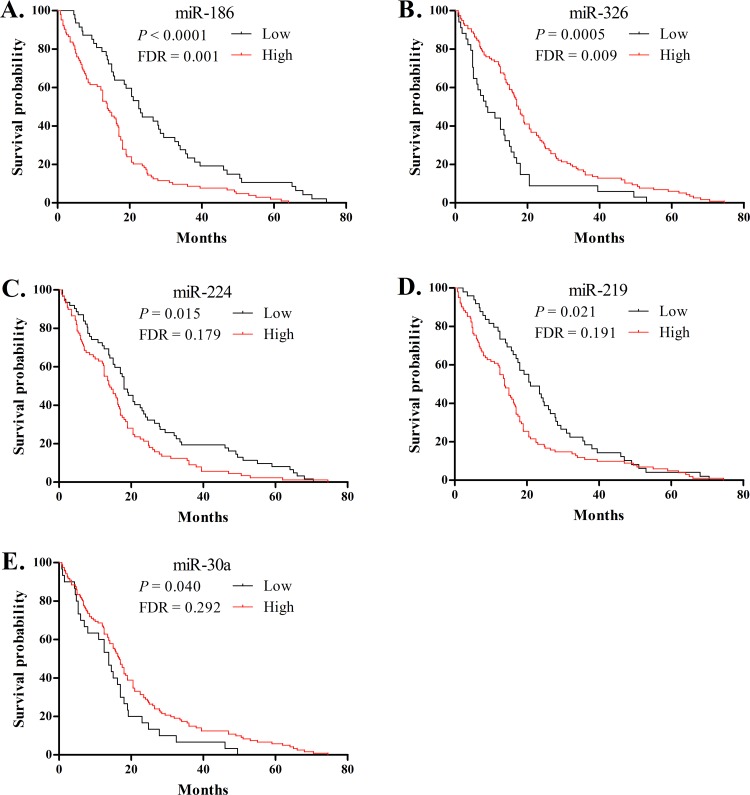
Fig 2. Kaplan-Meier curve for overall survival in patients with PDAC based on the binomial variable of high or low expression relative to the mean expression of miR-186 (A), miR-326 (B), miR-224 (C), miR-219 (D), miR-30a (E) using RT-PCR.
Survival curves were compared by log-rank analysis for 36 miRNAs, and the ones with P < 0.05 are shown in this figure. FDR for each test result was calculated by the Benjamini and Hochberg method.

