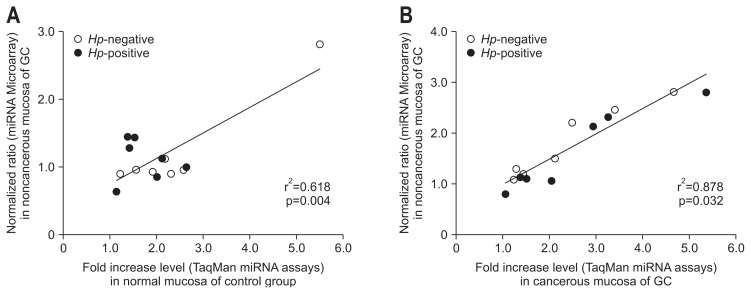
Fig. 2.
Correlation analysis representing the corresponding fold-increase levels from the TaqMan miRNA assays for the same microRNAs (miRNAs) in the miRNA microarray. (A) Between noncancerous mucosa from Helicobacter pylori (Hp)-positive and H. pylori-negative gastric cancer groups and normal mucosa of H. pylori-positive and H. pylori-negative control groups. (B) Between cancerous mucosa of H. pylori-positive and H. pylori-negative cancer groups. r2, Spearman correlation coefficient; p, value of paired Student t-test.
GC, gastric cancer group.

