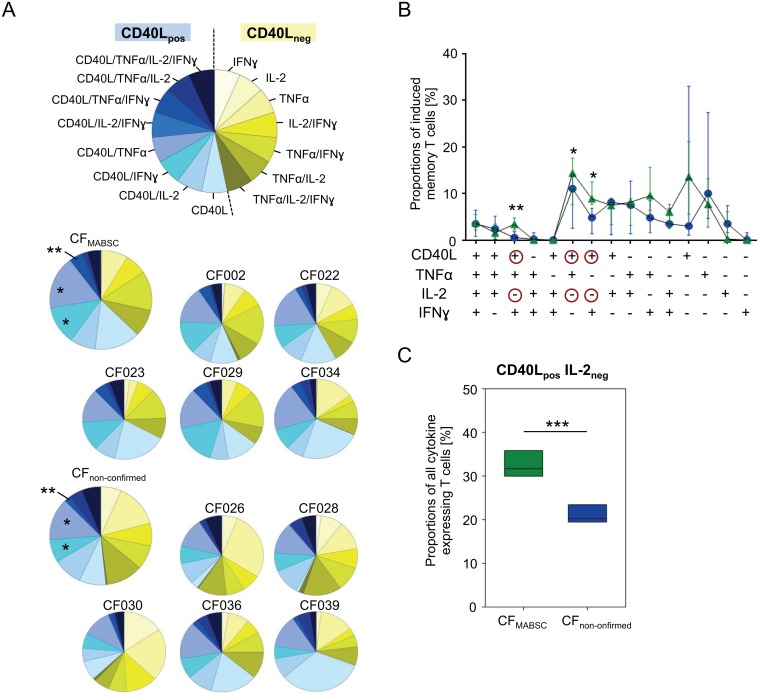
Fig 5. Cytokine expression patterns of MABSC-specific T-cells.
Cytokine expression pattern of MABSC-specific T-cells for TNFα, IFNɣ, IL-2, and CD40L are shown. Data were normalized for each individual donor by setting the number of all cells expressing at least one cytokine to 100%. (A) CD40L positive (blue colors) and CD40L negative (yellow colors) subpopulations with different cytokine expressing subpopulations are indicated. An explanatory pie chart is depicted at the top. Pie charts represent data of individual CF patients (with the patient ID indicated above) and mean values for each study group (upper left pies). (B) CF patient groups with confirmed MABSC infection (green triangles) and non-confirmed MABSC responders (blue circles) are compared for cytokine expression pattern of MABSC-specific T-cells (i.e. quadruple, triple, double, single positive). Line and scatter plots indicate median expression levels and standard deviation (y axis) of distinct cytokine pattern expressing subsets (x-axis). Red circles highlight CD40L and IL-2 expression status for significantly different subsets. The student t test was used to evaluate data between study groups and significant differences are indicated as asterisks; *: P<0.05 **, P<0.01. (C) A box plot shows the sum of all CD40Lpositive and IL-2negative T-cell subsets for MABSC infected CF patients (green) and non-confirmed MABSC responders (blue). The student t test was used to evaluate data between study groups. Significant differences are indicated as asterisks; ***, P<0.001.

