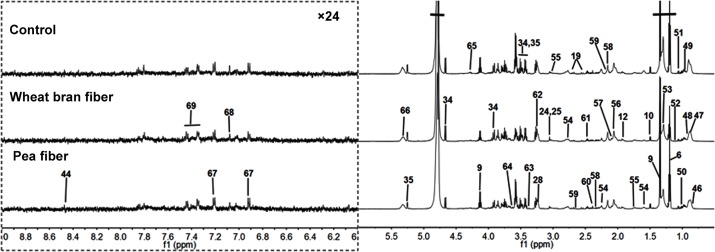
Fig 1. Representative one-dimensional 1H NMR spectra urine metabolites obtained from the (A) control, (B) pea fiber, and (C) wheat bran fiber groups.
The region of δ6.2–9.5 was magnified 16 times compared with corresponding region of δ0.5–6.2 for the purpose of clarity. Metabolite keys are given in Table 5.

