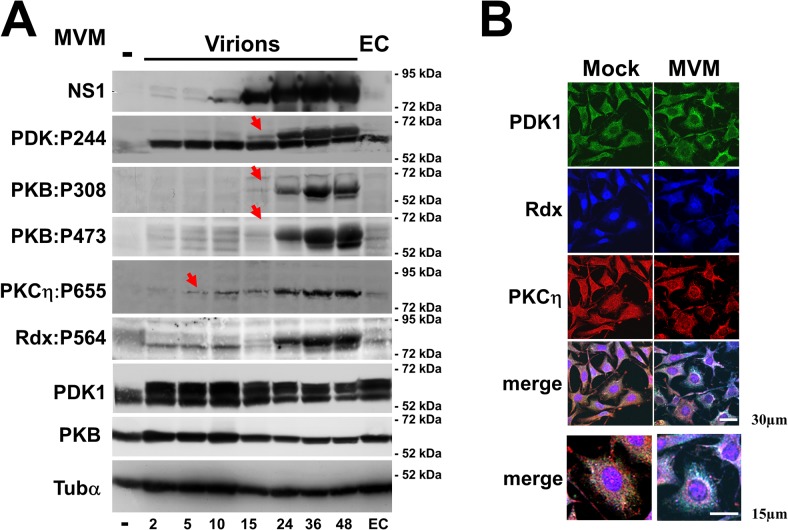
Fig 1. MVM-induced activation of the PDK1/PKC/PKB signaling cascade.
As shown previously, MVM activates Rdx [22], PDK1, and PKCη [8] in permissive A9 mouse fibroblasts. This activation is accompanied by PDK1 and PKCη translocation from the plasma membrane to the perinuclear area, where PKCη co-localizes with Rdx [8,22]. (A) Asynchronously growing A9 cells were infected (or not) with CsCl-purified full MVM capsids (30 pfu/cell) or an equivalent amount of empty capsids (EC). Total cell extracts were prepared at the indicated times p.i. Activation of selected cell proteins by MVM was monitored by western blotting on the basis of the proteins’ capacity for auto-phosphorylation (PDK1phosphoS244; PKCηphosphoT655) or of their trans phosphorylation at residues known to be essential for activation (Rdx:phosphoT564, PKBphosphoT308 [PDK1 target] and PKBphosphoS473). These protein modifications were detected with phospho-specific antisera. Total amounts of PDK1 and PKB were determined in parallel, and α-tubulin was used as an internal control. It is noteworthy that PKCη activation (starting at 5 h p.i., red arrow) precedes activation of the slower migrating PDK1 form and PKB (starting at 15 h p.i., red arrows). In addition, like PDK1, a slower migrating form of Rdx becomes activated at 15 h p.i. coinciding with its phosphorylation by the NS1/CKIIα complex [22]. (B) Impact of MVM infection on the subcellular distribution of PDK1, PKCη, and radixin. A9 cells grown on spot slides were infected (or not) with CsCl-purified MVM (30 pfu/cell) and examined 36 h p.i. by confocal laser scanning microscopy to confirm colocalization of PDK1 (green), PKCη (red), and Rdx (blue). Colocalization appears white in the merge and was quantified with Image J software. Scale bars: 30 and 15 μm, as indicated.

