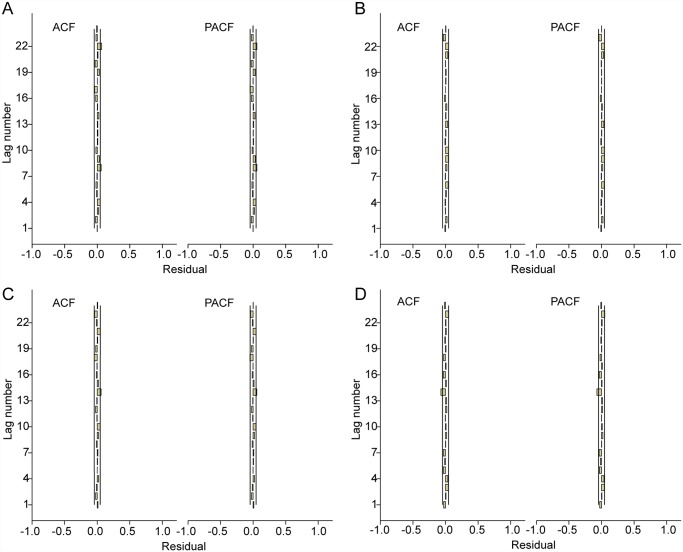
Fig 4. ACF and PACF plots of residuals after applying the appropriate SARIMA model.
A: ACF and PACF plot of residuals of SARIMA (0,1,1)(2,0,1)52 model for Datong. B: ACF and PACF plot of residuals of SARIMA (2,1,3)(1,1,1)52 model for Taiyuan. C: ACF and PACF plot of residuals of SARIMA (0,1,1)(0,1,1)52 model for Changzhi. D: ACF and PACF plot of residuals of SARIMA (0,1,1)(1,1,2)52 model for Yuncheng.

