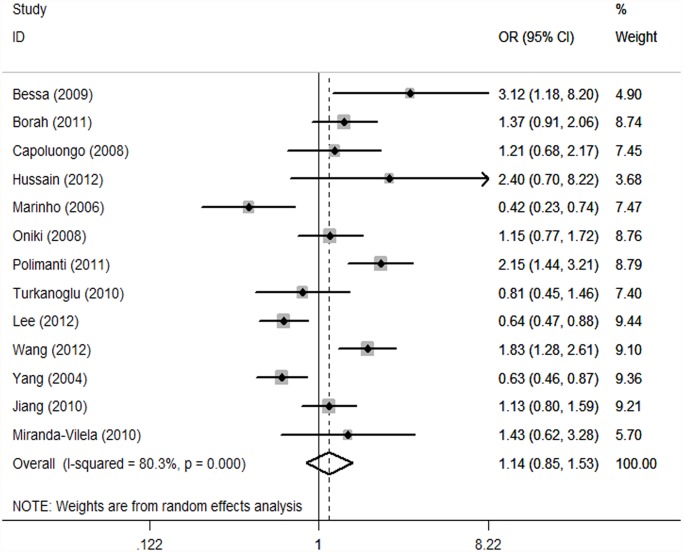
Fig 4. Forest plot of the GSTT1 null genotype and hypertension risk in overall analysis.
The squares indicate the odds ratios in the individual studies; each square’s size is proportional to the weight of the corresponding study in the meta-analysis. The diamond indicates the pooled odds ratio. Horizontal lines represent 95% confidence interval. The unbroken vertical line is at the null value (OR51.0).

