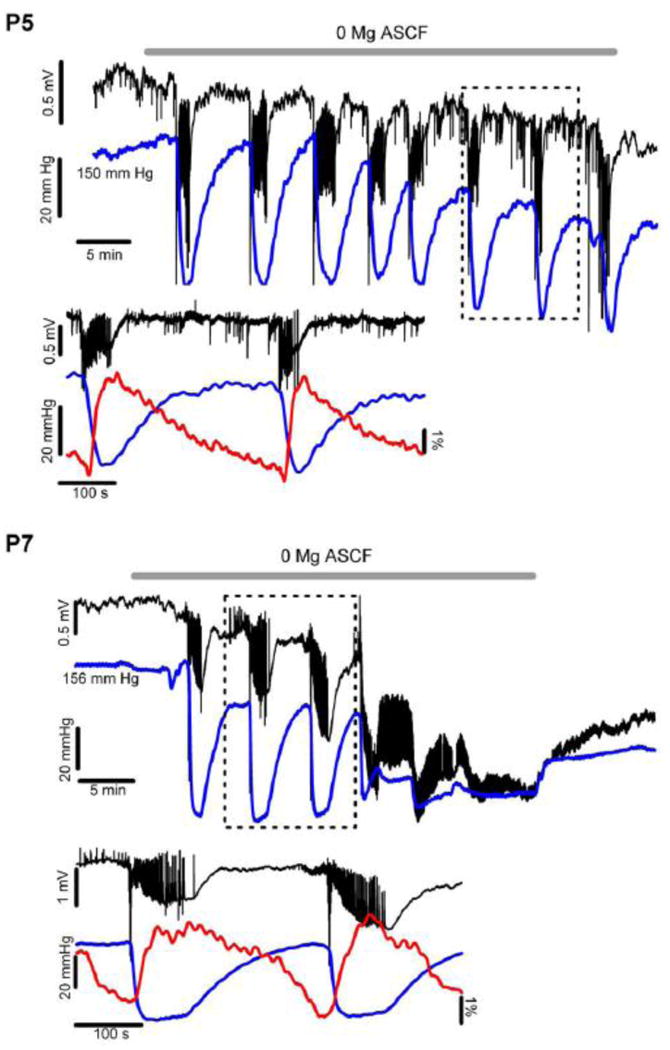
Figure 4. Tissue Oxygen Recordings during P5 and P7 ILEs.

These examples demonstrate tissue oxygen levels (blue trace for both P5 [upper panel] and P7 [lower panel]) before and during low Mg2+ aCSF (ambient O2 of 95%). Note that there is an oxygen dip associated with each ILE occurrence, indicating a large, increased metabolic demand during each ILE (lower traces show detail for P5 and P7 panels). Note that the overall oxygen tension baseline declines slightly after multiple ILEs, suggesting an increased overall oxygen debt within the tissue over time. In the P5 experiments the ILE oxygen dip remained nearly constant over the low Mg2+ exposure, averaging near 80 mm Hg overall (Fig. 5E). In the P7 experiments the oxygen dips associated with each ILE were slightly larger, averaging near 120 mm Hg (Fig. 5E). After several ILE occurrences at P7 the tissue response to the low Mg2+ changed, turning into more diffuse, smaller amplitude and nearly continuous epileptiform spikes (termed LRDs, see also Fig. 3 A, c1 and C1). At this transition the tissue O2 remained at a low level (but still above zero), only slightly increasing even after the low Mg2+ condition was reversed back to normal aCSF, coincident with the ongoing, irreversible LRD activity. This marked increase in tissue O2 utilization suggests considerably increased tissue oxygen demand (and a high metabolic rate) associated with the highly synchronous (but low voltage) LRD events, suggesting nearly continuous epileptiform events. The maintained oxygen utilization during the later phase of P7 experiments correlates well with the heightened NADH levels, both confirming intense metabolic need during the LRD phase. The lower traces for both P5 and P7 show details of the field potential activity, oxygen and NADH, indicating that the oxygen dip coincided with the start of the ILE.
