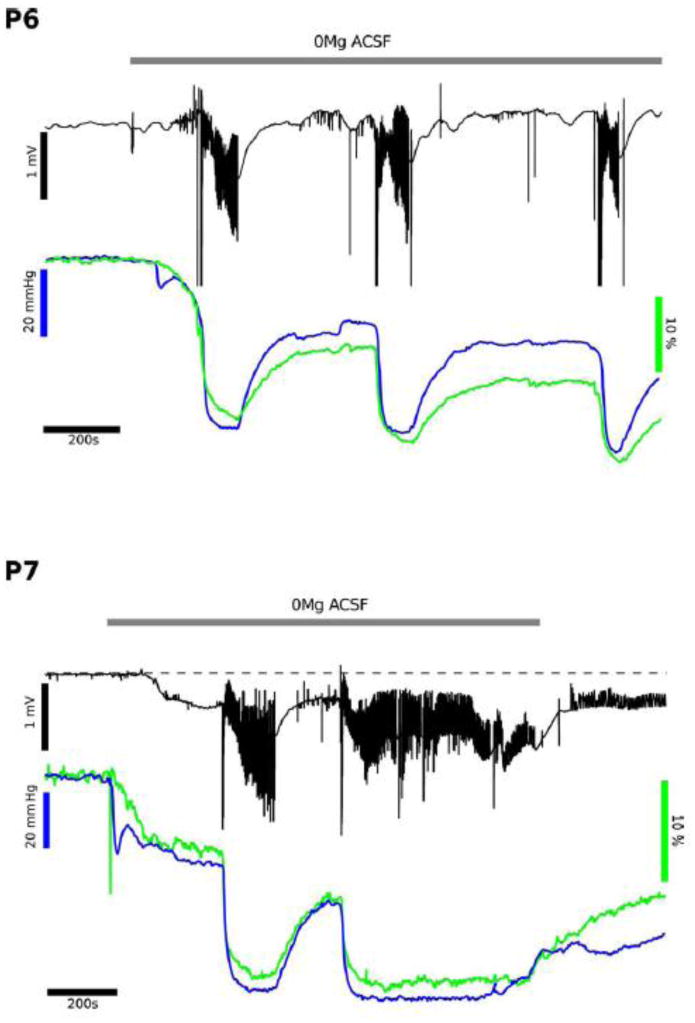
Figure 6. FAD and Tissue Oxygen Levels at P6 and P7.

To complement the fluorescent NADH imaging (ie, Fig.'s 1,2,3) FAD imaging measurements (blue) were used in conjunction with field potential measurements (black) and tissue oxygen levels (green). In the upper panel the low Mg2+ conditions were tested at P6, showing repeated interictal like events (ILEs) with FAD showing primarily reduction events (ie, less oxidized FAD) and no initial oxidation with each ILE. At P7 the ILE event appears similar to P6, but once the late recurrent depolarization events begin then there is a persistent reduction (similar to the NADH), suggesting a high rate of ongoing metabolism, as noted by the persistent low O2 level. These FAD recordings confirm the NADH fluorescence findings.
