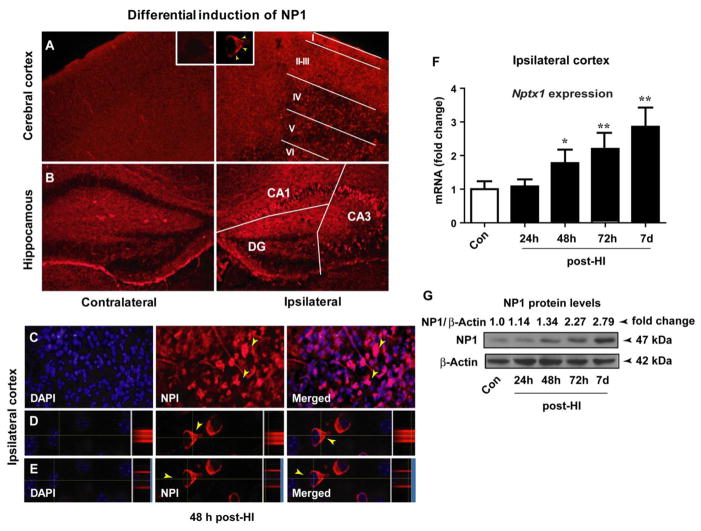
Figure 4.
NP1 inductions in the cerebral cortex and hippocampal areas of WT animals following HI. Immunostaining of WT brain sections (20 μm) with NP1-specific antibody showed intense NP1 immunofluorescence in different layers of the ipsilateral cortex as compared to the contralateral side and sham controls. The negative control for NP1 immunostaining was performed by replacing NP1 primary antibody with nonimmune IgG. A) NP1-specific immunoreactivity showed differential distribution of NP1 in the different cortical layers (I–VI) with more intense immunoreactivity was observed in layers I–III as compared to the deeper layers (IV–VI). NP1-specific immunofluorescence in individual neurons is shown at 100 X magnification (inset). Similarly, a high level of NP1 immunoreactivity was observed in the hippocampal pyramidal layer of the ipsilateral-CA3 and -CA1, but not in DG, areas relative to the contralateral hemisphere and sham controls (B). C) NP1 induction was more pronounced at 24 h which persisted up to 7 days post-HI, examined. D, E) Orthogonal view, NP1 cellular localization is more pronounced in the perinuclear region of the cytoplasm, but not in the nucleus. Representative images are shown. F) Induction of NP1 expression in cerebral cortex at different time periods following HI. Total RNA was extracted from cortical tissue and NP1 mRNA expression levels were analyzed by quantitative real-time PCR. Fold induction is the ratio of NP1 to internal control HPRT. Values are mean ± SEM (n=5; *p<0.05, **p<0.01, ***p<0.001). G) Total proteins from cortical tissue were analyzed by SGS-PAGE and immunoblotted for NP1 protein. The NP1 antibody detected a distinct single band of NP1-immunoreactive protein of molecular mass 47 kDa. The β-actin serves as loading control. Values are NP1/β-actin ratio and expressed as fold changed over controls. Representative bands are shown (n=5).

