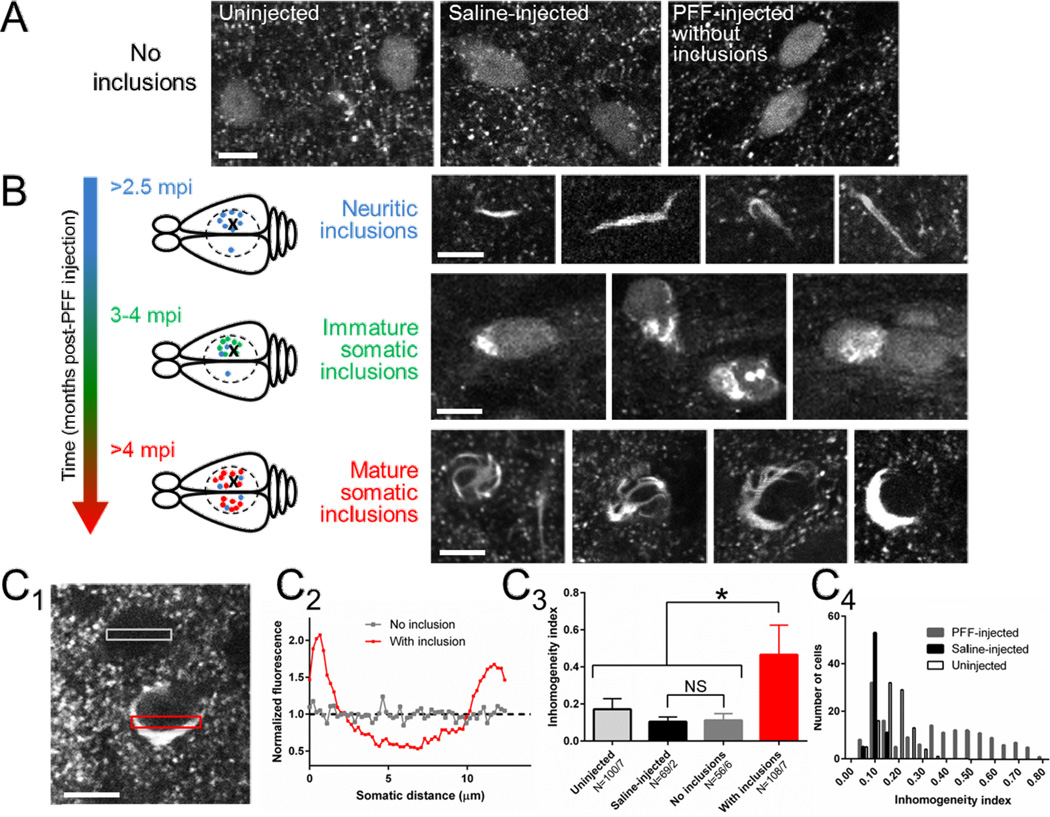
Figure 1. In vivo imaging demonstrates a stage-like, progressive maturation of Syn-GFP inclusions within neurons.
A) In vivo imaging in cortex layer II/III of uninjected (left), saline-injected (middle) or PFF-injected (right) animals at 2 mpi demonstrates punctate presynaptic staining within the neuropil and only homogenous somatic Syn-GFP staining within neurons. Scale bar 10 µm.
(B) Top: Starting at 2.5 mpi, imaging near the PFF injection site demonstrates frequent neuritic Syn-GFP aggregates in layer II/III, and rare neuritic aggregates in the contralateral hemisphere in the symmetric location to the injection. Schematic representation shows injection location in the right hemisphere (X), extent of cranial window (dashed circle), and location of neuritic aggregates (blue dot). Scale bar 10 µm. Middle: At 3–4 mpi, neurons (green dot in schematic) near the injection site began showing neurons with both disorganized somatic Syn-GFP inclusions and normal homogenous staining. Scale bar 10 µm. Bottom: At 4–13 mpi only mature, organized somatic and neuritic Syn-GFP inclusions are present. Mature somatic inclusions have a stereotyped appearance, often with a single juxtanuclear accumulation and legs that wrap around the nucleus, giving a “spider-like” appearance. The normal homogenous somatic and nuclear Syn-GFP staining is absent in neurons containing mature inclusions. Schematic representation shows location of numerous mature somatic inclusions (red dot) near the injection site and in the contralateral hemisphere. Scale bar 10 µm.
(C) Example of two neurons (C1), one with normal homogeneous staining and one with a mature inclusion, and transect ROIs used to measure fluorescence (C2) across the cell body. An inhomogeneity index was calculated (see Methods) and used to measure the mean index value (C3) in neurons from uninjected, saline-injected, and PFF-injected animals with and without inclusions. Neurons from uninjected, saline-injected and PFF-injected animals without inclusions show low levels of inhomogeneity, while inclusion-bearing neurons from PFF-injected animals were significantly more inhomogeneous. N = cells/animals. Histogram of inhomogeneity index values from cells from all three groups (C4) shows single populations with low inhomogeneity in uninjected and saline-injected animals, while PFF-injected animals show two distinct populations, a low index one nearly identical to saline-injected animals, and a high index population corresponding to neurons with mature somatic inclusions. Scale bar 10 µm.

