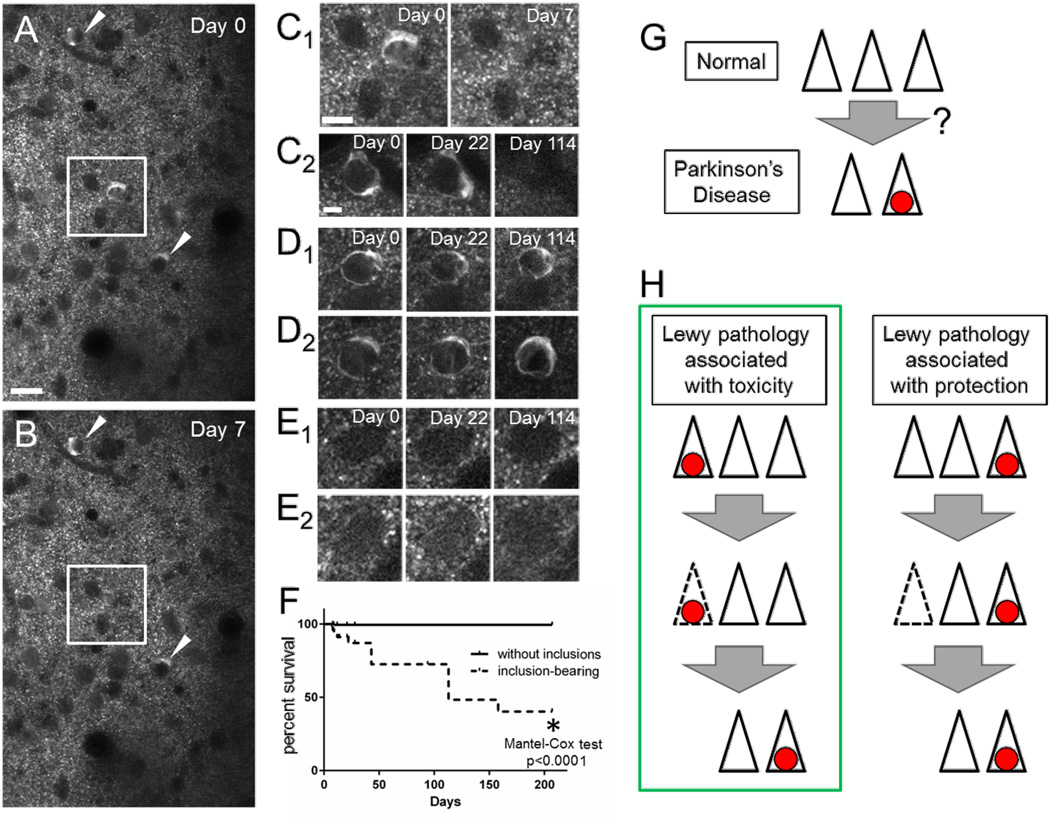
Figure 4. Chronic in vivo imaging demonstrates selective degeneration of inclusion-bearing neurons.
Field of neurons (A&B) imaged one week apart demonstrate blood vessels by their negative stain, multiple neurons without inclusions and three mature inclusion-bearing neurons (white square & arrowhead) on Day 0. Scale bar 20 µm. One of these neurons (white square) degenerates by Day 7 and is shown at higher power (C1). Scale bar C1 10 µm, C2-E2 5 µm. Chronic imaging of individual neurons over months shows degeneration of some inclusion-bearing cells (C) with persistence of other cells with (D) and without (E) inclusions. Group data (F) shows selective degeneration of inclusion-bearing neurons over 7 months. Schematic showing the loss of neurons in brain regions affected by Parkinson’s Disease with the presence of Lewy pathology (red circle) in some of the remaining cells (G), and two different models for how this same final state might arise (H). One model posits a positive correlation between Lewy pathology presence and cell death, while the other an inverse correlation.

