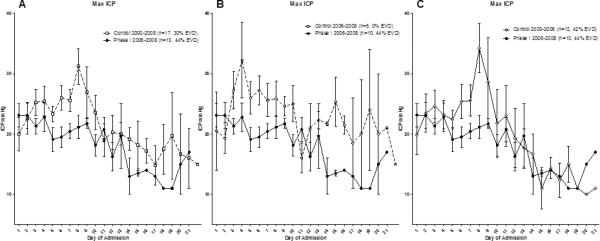
Figure 5.

When plotting maximum ICP per day, there appears to be a cell therapy related decrease in maximum ICP values per day beginning approximately 48 hours after treatment which can be seen when the Phase I 2006-2008 group is compared with A) all controls B) time matched controls from 2006-2008 and C) controls from 2000-2006.
