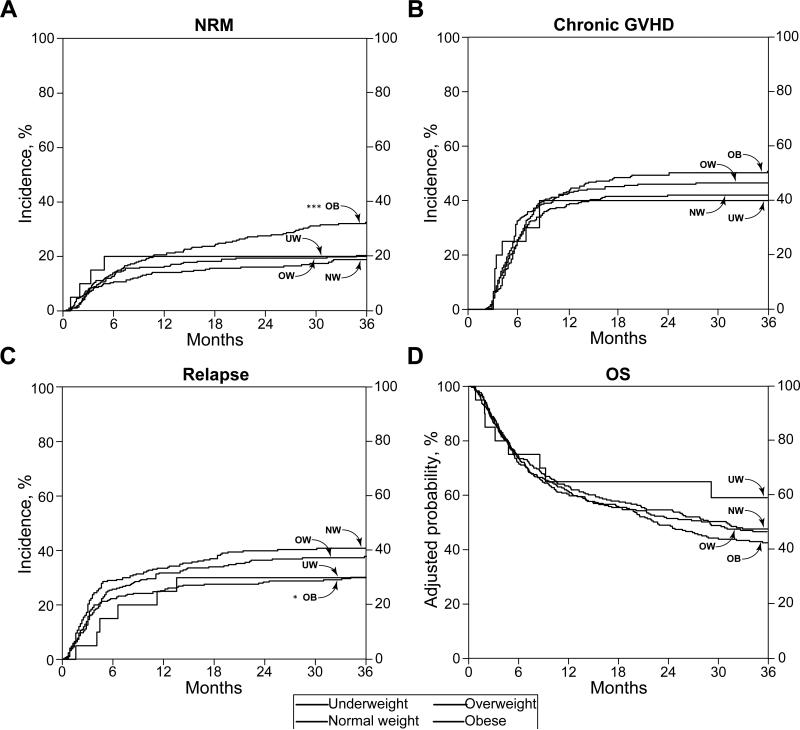
Figure 1. Transplant outcomes by body mass index category.
Cumulative incidence of non-relapse mortality, p<0.001*** (A), chronic graft-versus-host disease, p=0.07 (B), relapse, p=0.02* (C), and adjusted probability of overall survival, p=0.13 (D). N = 20 underweight (UW), 290 normal weight (NW), 287 overweight (OW), 301 obese (OB). P-values represent outcomes of obese relative to normal weight patients.

