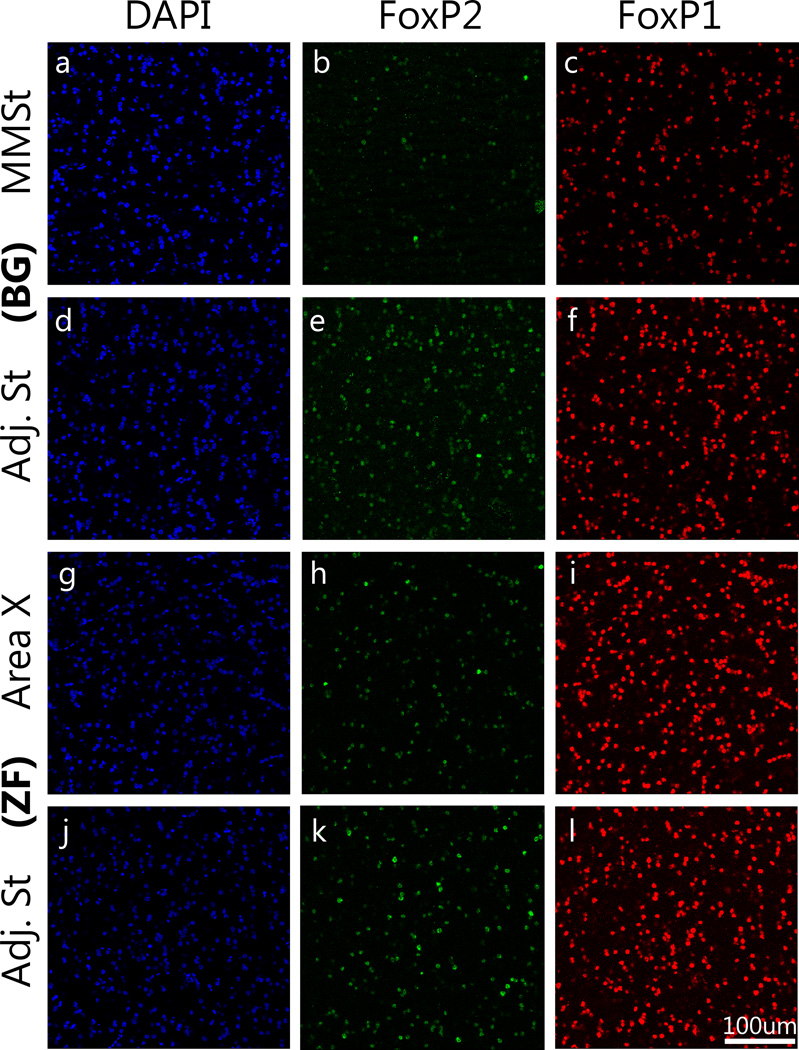
Figure 3.
Immunohistochemical detection of FoxP2 and FoxP1 proteins. Top two rows are budgerigars (BG: a–f) and bottom two rows are zebra finches (ZF: g–l). DAPI staining exposes all the cells in the area (Blue: a, d, g, j). FoxP2 (Green) reveals a lower expression in the MMSt compared to the adjacent striatum while the expression level is consistent throughout the striatum in zebra finches (b, e, h, k). Red signal indicates FoxP1-positive cells, which demonstrate constant expression levels throughout area and species (c, f, i, l). Scale bar = 100 µm.

