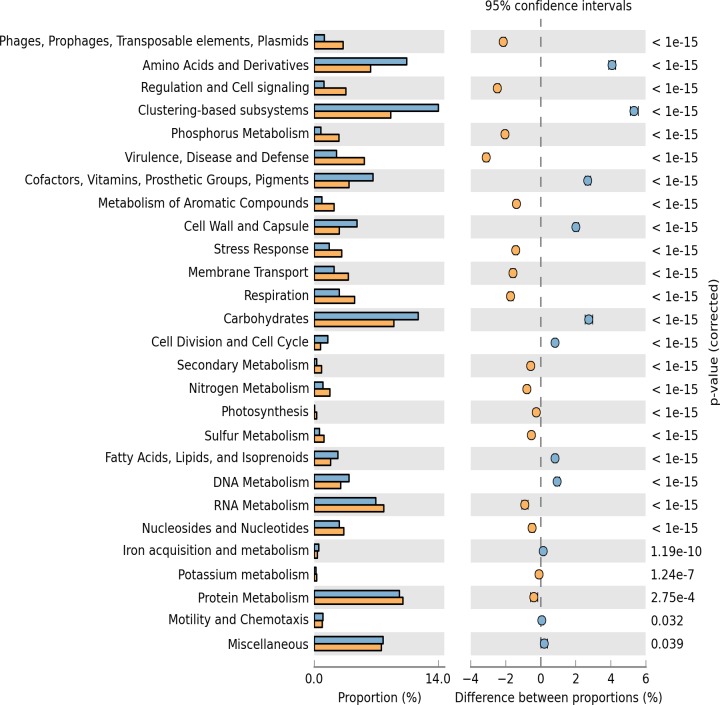
Fig 4. Significant SEED subsystem differences as a result of a Fisher exact test between the MSS and RAW metagenomes conducted with the STAMP program.
Enrichment of SEED subsystem in the RAW metagenome has a positive difference between proportions (blue circles), whereas enrichment of SEED subsystem in the MSS metagenome has a negative difference between proportions (orange circles). Bars on the left represent the proportion of each subsystem in the data. Subsystems difference with a p value of >0.05 were considered to be significant.

