
Fig 4. Discrimination of fibrosis stages based on patient group with necroinflammatory activity grade 1.
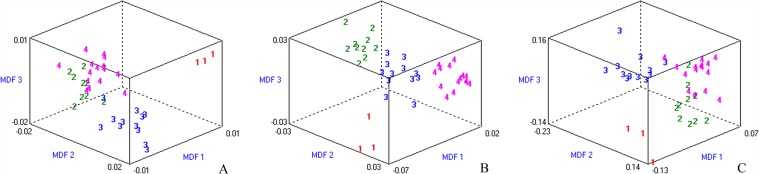
Misclassification rates were 5.00%, 0% and 12.50% in T2W (A), T1W (B) and EOB-HP (C) images, respectively. The three-dimensional distribution of data vectors is based on the top three of the 30 texture features that were extracted using Fisher+POE+ACC+MI method, followed by LDA/1-NN classification: fibrosis stage 1 (1), stage 2 (2), stage 3 (3), and stage 4 (4). MDF1, MDF 2 and MDF 3 are the most discriminating features axes used in LDA to represent the classification graphically.